We are currently testing if checkmk is the right tool for us to monitor interface bandwidth usage on our network equipment. We currently use 1.6.0p19 RAW on a CentOS 8 VM with about 500 Hosts and 9k services (about 1/6 of our devices).
One issue we got so far is that checkmk very rarely reports interface bandwidth usage that is above the interface speed on Juniper firewalls.
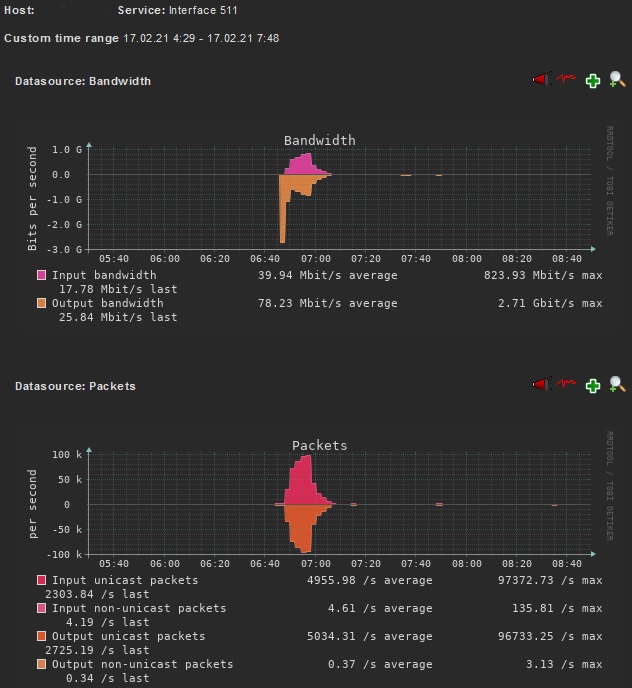
We monitor almost 200 Juniper SRX340 firewalls and already seen two of them (JUNOS 18.4R3-S4.2) with a bandwidth usage of 10G and 3G for one check interval even though the interfaces are only capable of 1G.
This reduces the trust we have in the reporting of bandwidth usages and raises the question if this could be an issue with checkmk or SNMP data sent by our firewalls.
Is there a way to get the raw SNMP data for a specific time?
If we can get the raw data and it also shows that the firewall actually sent ~3G, we can open a case with Juniper.
To get the raw data is complicated.
The interface check is calculating the current rate with the counter value from the check interval before.
One question - how long is your check interval for the check_mk service and for this interface service?
Booth should have the same value (default is 1 minute or 60 seconds).
I have some HPE device in my monitoring environments where it is very common that the counter gives not the right value but that where the only devices with such a behavior.
Other point is happens this problem more than one time per device?
We set the check interval of all services to 2 minutes, since some devices with many interfaces tend to take aroud 90s to complete SNMP requests.
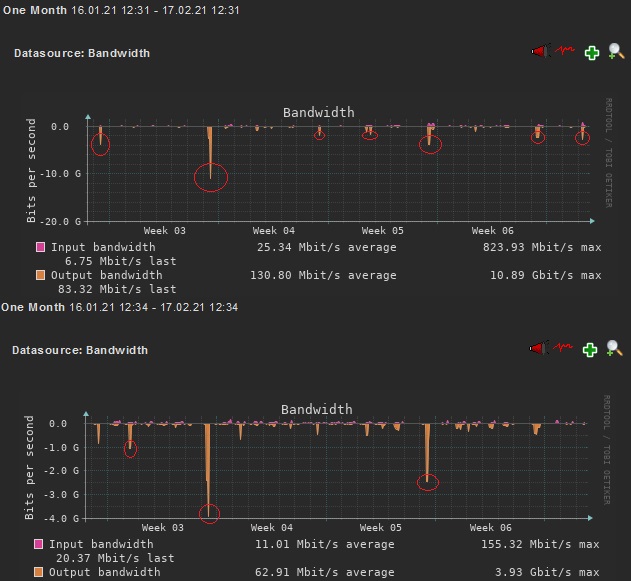
It also happens more then once per device, here is a screenshot of interfaces from two different devices:
Very interesting, it happens at the same time on booth systems
I don’t know a simple solution for this problem as it looks like the device is reporting very high values but for more than one device at the same time it is strange.
Can you have a look at your monitoring machine. How is the CPU load / I/O and so on at this machine?
The VM has 20 cores, 32GB RAM and all-flash storage.
CPU load is around 20-50
CPU util around 40-50%
RAM at 3GB (+10GB cache)
1100 Threads
There are spikes here and there, but not at the times of the high bandwidth usage.
Storage and network should be pretty bored, since that’s pretty beafy hardware.
We added more hosts last week and had load issues last friday, so we disabled more than 100 hosts, currently there are 422 hosts with 8952 services monitored (almost all of them through SNMP).
We want to figure out the issue before we take the time to setup more checkmk servers in a distributed monitoring configuration.
This topic was automatically closed 365 days after the last reply. New replies are no longer allowed. Contact @fayepal if you think this should be re-opened.