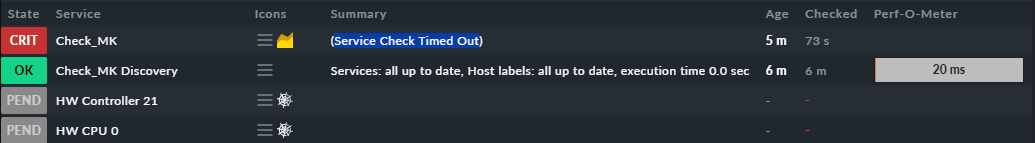
Output of “cmk --debug -vvn hostname”: all services are displayed correctly
After updating the firmware to 1.76, iLO6 shows all services as “unkn” in CMK. However, when I enter ‘snmpwalk’ or “cmk --debug -vvn” in the terminal, all services are displayed correctly.
The credentials are correct. Even when creating a completely new host, all services still show as “unkn.”
Does anyone have any idea what might be causing this?
Thank you for your support.
Check_MK and Check_MK Discovery you cannot disable as the “Check_MK” service produces all the other data used for the check.
All the other checks are “Yellow” as you tried an active check on these. I would first reset all changed attributes of these services.
It is very important to not play around with activate and deactivate active/passive services on such a host.
Unfortunately, we haven’t been able to resolve the issue yet.
What’s strange is that it used to work without having to increase the timeout or make any special settings in general. On one server, it currently works without any additional adjustments, such as changing the timeout.
We changed the timeout to 60 seconds as a test, since the service check keeps ending with a timeout, but that did not solve the problem. We received the following error message during the connection test:
“API Error: Error running automation call <>diag-host: Your request timed out after 110 seconds. This error may be related to your local configuration or a request that is processing too many objects at once. If you believe this is a software bug, please send us a crash report.”
We are using the latest 2.4.0p30 version of Checkmk Community.
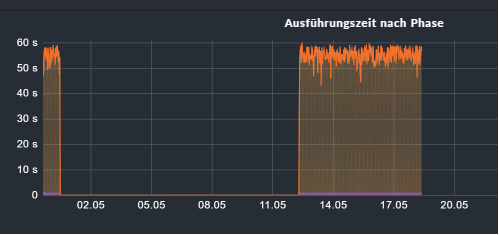
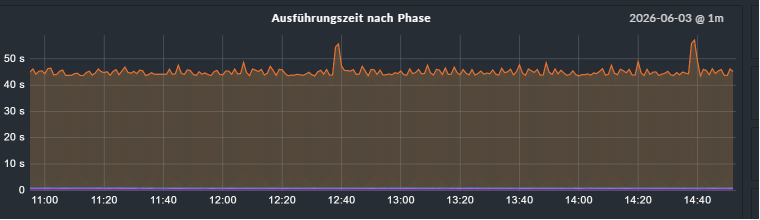
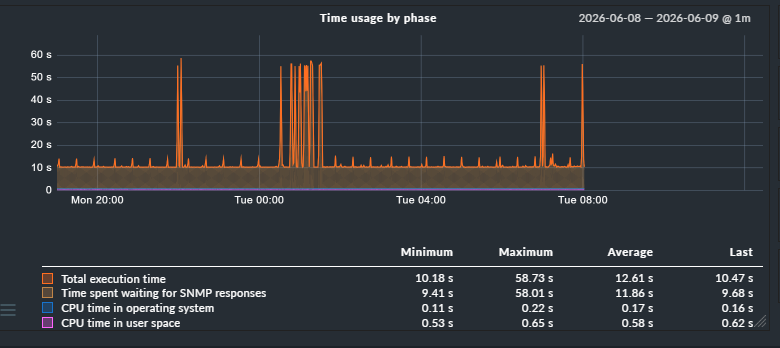
If i see the graphs for the working and not working iLO interfaces i would say - booth are way too long on answer times. Do you have interface checks on these interfaces? If yes please remove these interface checks from the monitoring. The data for these interface checks is pulled from the OS and not from the iLO, this takes a very long time.
Do you have a complete list of services you monitor on such an iLO interface?
Also please check if the usage of the Redfish integration would decreases the time needed.
However, we would like to monitor the most important interfaces, just like on the other server where the service check works—even with more interfaces. Why do the checks work on one server but not on the other? Is there anything else we can configure, or would RedFish be the only solution?
We are currently still monitoring everything that is provided to us, including some hardware fans, hardware memory, and many temperature readings. In total, including the interfaces, there are 83 services. We still need to determine which of these services are truly important to us.
Then you should do this from the OS not over the management interface as this also pulls the data from the OS. Only if you do it with SNMP. The interface checks inside Redfish only get the status from the management directly.
This depends more on the host OS and the installed or not installed management agents.
Here you will “only” get the status data of the components no traffic as the management interface has no own information about performance data.
If you want only one high level view of your management interface then you can do this with Redfish and only fetch the system state data. There you have then only a hand full of services. But these few services give you the roll-up state of the whole system.