**CMK version:**CentOS Linux release 7.9.2009 (Core)
**OS version:**2.1.0p10.cre;2.1.0p10;cre;0
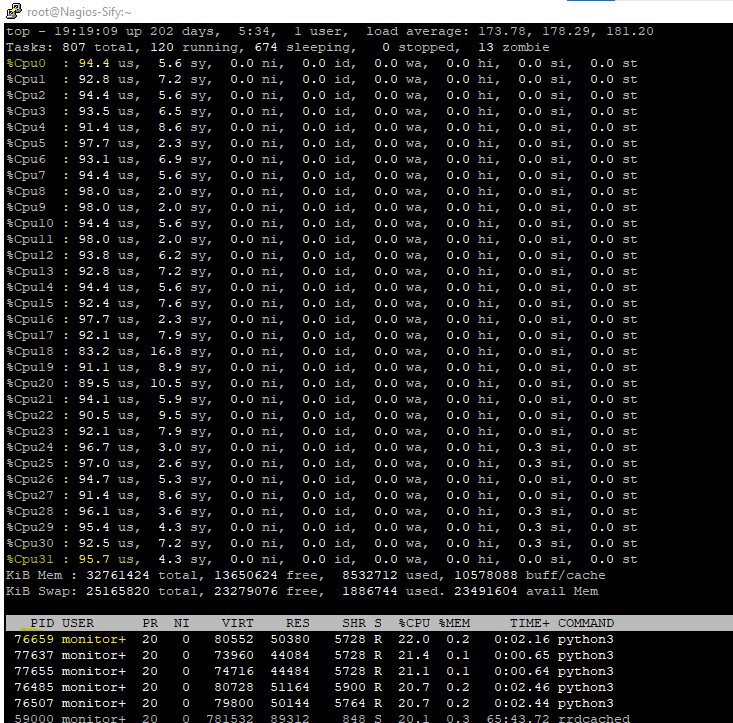
Error message: CPU utilization” 99%. Server have 32 core,
Output of “cmk --debug -vvn hostname”: (If it is a problem with checks or plugins)
**CMK version:**CentOS Linux release 7.9.2009 (Core)
**OS version:**2.1.0p10.cre;2.1.0p10;cre;0
Error message: CPU utilization” 99%. Server have 32 core,
Output of “cmk --debug -vvn hostname”: (If it is a problem with checks or plugins)
If the 100% are normal or not depends on many things. How many hosts are monitored by this instance? In what interval do you see this 100% usage spikes?
As i see a load of 170 it is very high for a 32 core CPU and this is over 5 minutes.
Does the HW/SW inventory check run every minute by any chance? This service check should only run once a day per host.
[kindly suggestion to reslove this issue]
Everyone here is participating on their free time, this is not a support forum.
I’ld restart my server, or at least restart cmk. you seems to have memory leak, for some reason swap is being used.
It’s also very unusual that all cores are in use for Checkmk as Python is not that well multi-threaded.
How do you do self monitor? are there any trends?
It is hard to give a definitive answer without knowing anything about the environment. How many hosts and services are you monitoring? How many of them are active checks, agent based checks, and SNMP devices? Is this a bare metal server or a VM, what CPU(s) has the underlying hardware, and is it overbooked?
From what I can see in the screenshot, you have neither memory nor I/O issues, but 32 CPU cores fully loaded, and the biggest consumers get only 20% of a core, so there seem to be >160 processes competing for CPU time in parallel.
Generally speaking, your situation can be any (or a mix) of
Misconfigurations could include (but not limited to)
It might be wise to hire a Checkmk consultant for a few days to inspect your configuration. Look up the list of Checkmk partners, there is a large network of competent people.
Next, Checkmk can be tuned in multiple ways, the details depend on the used edition (Nagios or CMC core). Especially the number of check helpers and checker helpers should fit to the number of available CPU cores. However, before starting to fine tune the setup, I would consider renewing the technology stack. CentOS 7 is quite old, if I remember correctly, it came with the Linux kernel 3.10. Also Checkmk should be updated to 2.2.0, the latest stable version.
Finally, you system could simply be overloaded. There are several options to deal with overloaded systems, including
Finally, if you use the Checkmk Raw edition, it could simply be that you reached the limits of the Nagios core and should give one of the commercial editions a try. The Checkmk Cloud edition can be fully evaluated for one month. Even if this does not fully solve your performance issues, it can make it easier to tune Checkmk to your needs.
@Heavy wow, this answer is awesome! I want to put more then one heart on it, but I can’t. Way t ogo man! ![]()
Also, a very basic question:
Is Checkmk the only thing running on that server? Or are there other applications running in parallel that could be causing this?
kindly find requested details for your reference .
1.in this server CheckMk only runing primary.
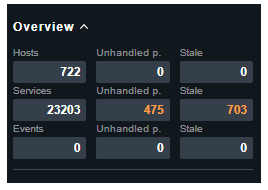
2.checkmk configured host = 722,Service = 23210
3. Display Refresh interval = 30 S
4.snmp device = currently 1 server.
This is not too much. I have seen Checkmk (Enterprise edition) sites on virtual machines with 8 cpu cores monitoring the double amount of hosts and four times the services. On a 32 core machine, this should not be a problem even for the Raw edition.
So I believe you either ran into a bug or have configuration issues.
I would recommend a mild renewal of the stack first. Update your site to the latest Checkmk 2.1 release, install all open CentOS 7 patches and reboot the machine.
If the problems persist, analyze you configuration. Run the Analyse configuration and inspect the findings. Watch for errors and warnings in the logfles of the Checkmk site and the operating system. Look for stale services and try to understand the reasons why they are stale. If many stale services come from the same checkplugin, test if a Disabled checks rule for this checkplugin reduces the load. Look for very big files among the cache directories like tmp/check_mk/cache/ or tmp/check_mk/piggyback. If you use 3rd party plugins (MKP files), disable them selectively and verify if it helps.
Alternatively, make a copy of your Checkmk site, update it to Checkmk 2.2 and then to the Checkmk cloud edition. Stop the original site and run the copy instead. Adjust the settings under Global settings → Monitoring core to fit your site. Verify if this solves the performance problems.
Or hire an expert to check your system.
thanks for your responses.
This topic was automatically closed 365 days after the last reply. New replies are no longer allowed. Contact an admin if you think this should be re-opened.