And I ask again, is the graph for this service shown correctly inside PNP4Nagios or not?
The error message looks like wrong formatted performance data. This leads to an error.
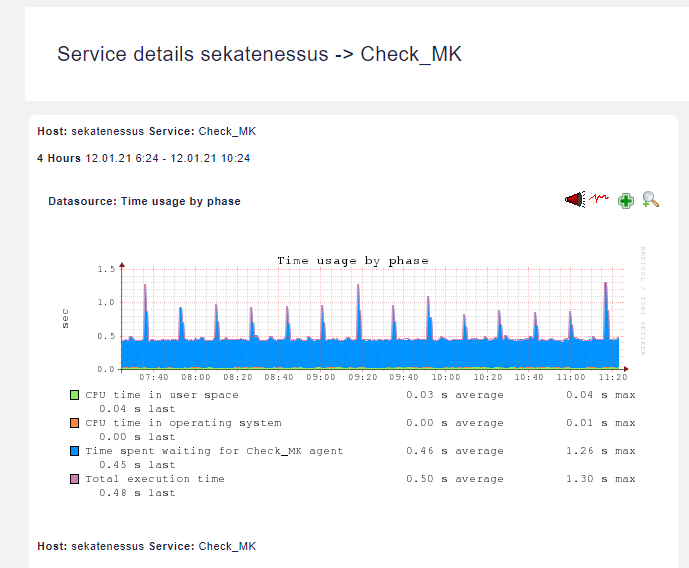
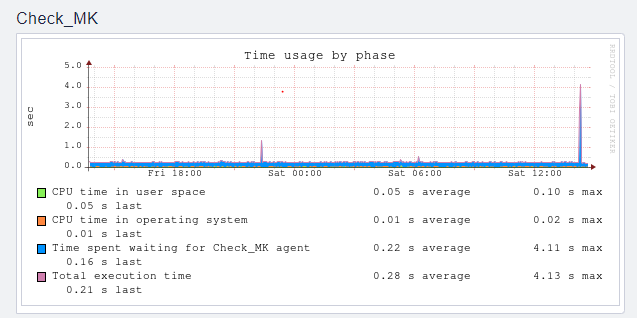
A small screenshot from this service PNP graph would be helpful.
Hi @andreas-doehler,
Is this what are you looking for?
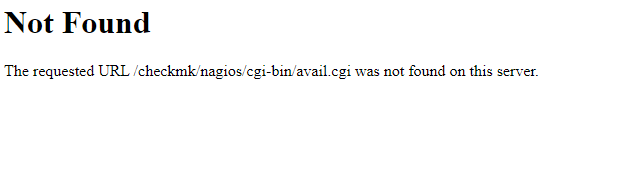
But If I go to nagios availability report , it says requested URL cant found in the server and this is coming for all the servers even for the ones which are having proper email notification as well. Its very Trichy
I think somewhere that we had lot of change weekends in last 4 mionths, so turn off turn on the VM would have impacted some configurations, shall I go for graceful restart of the system
/BR
Prachi
This email with the red text is coming for which service. Is it Check_MK for which you attached the graph from pnp4nagios as asked by Andreas ?
How is the situation now ? Did anything improved so far ? What is the current status ?
Hi @anonymous15,
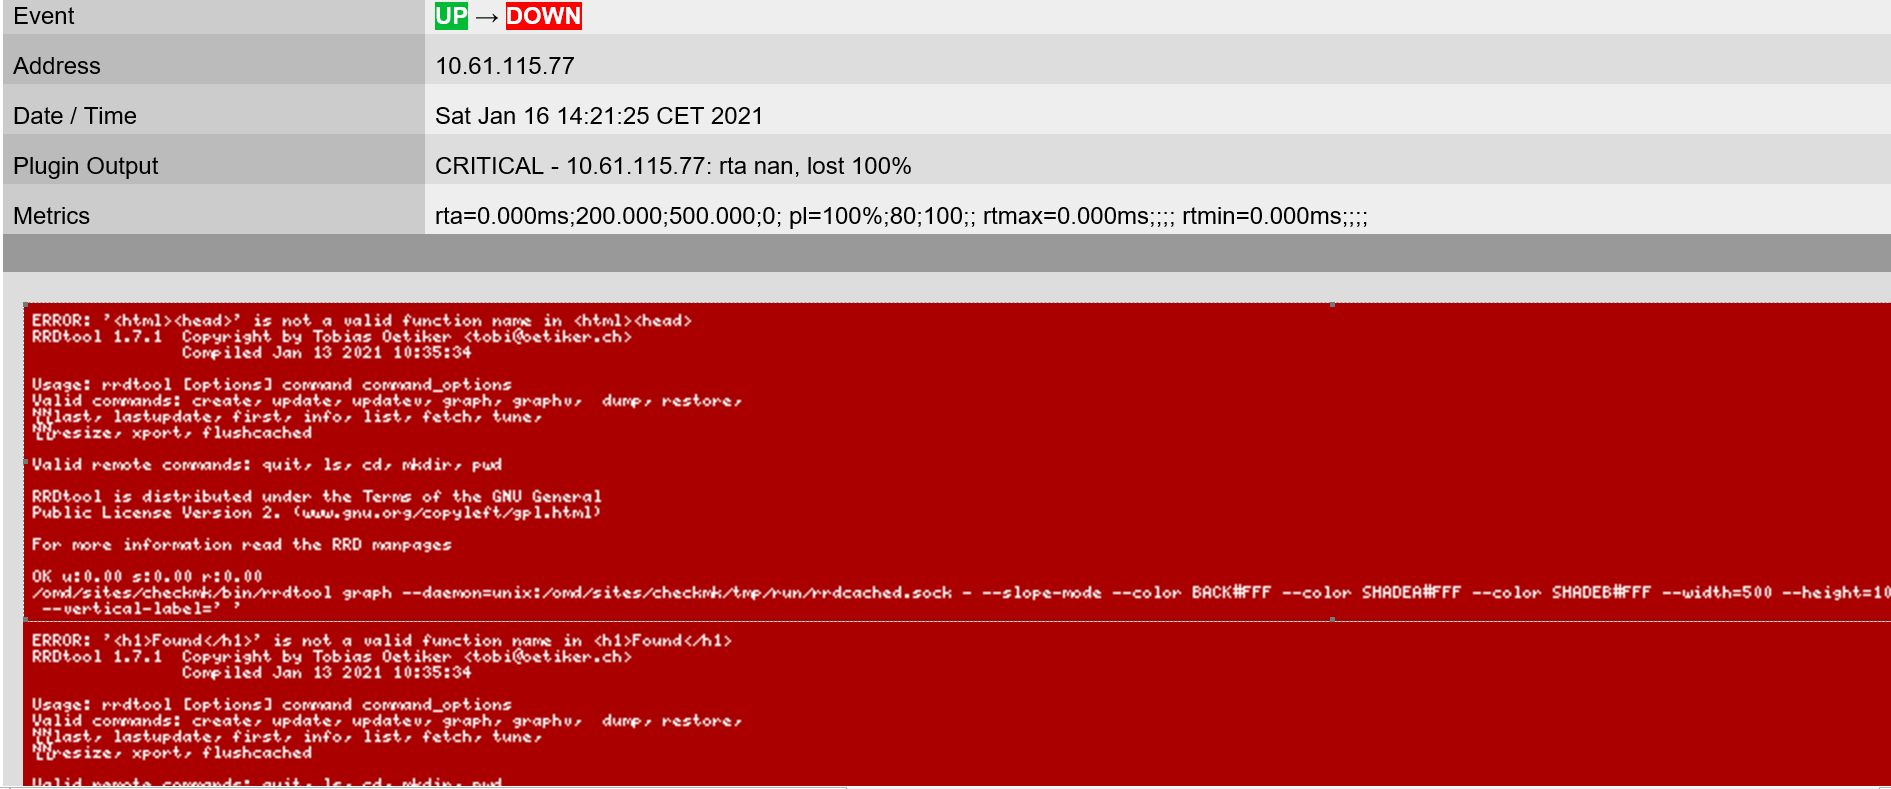
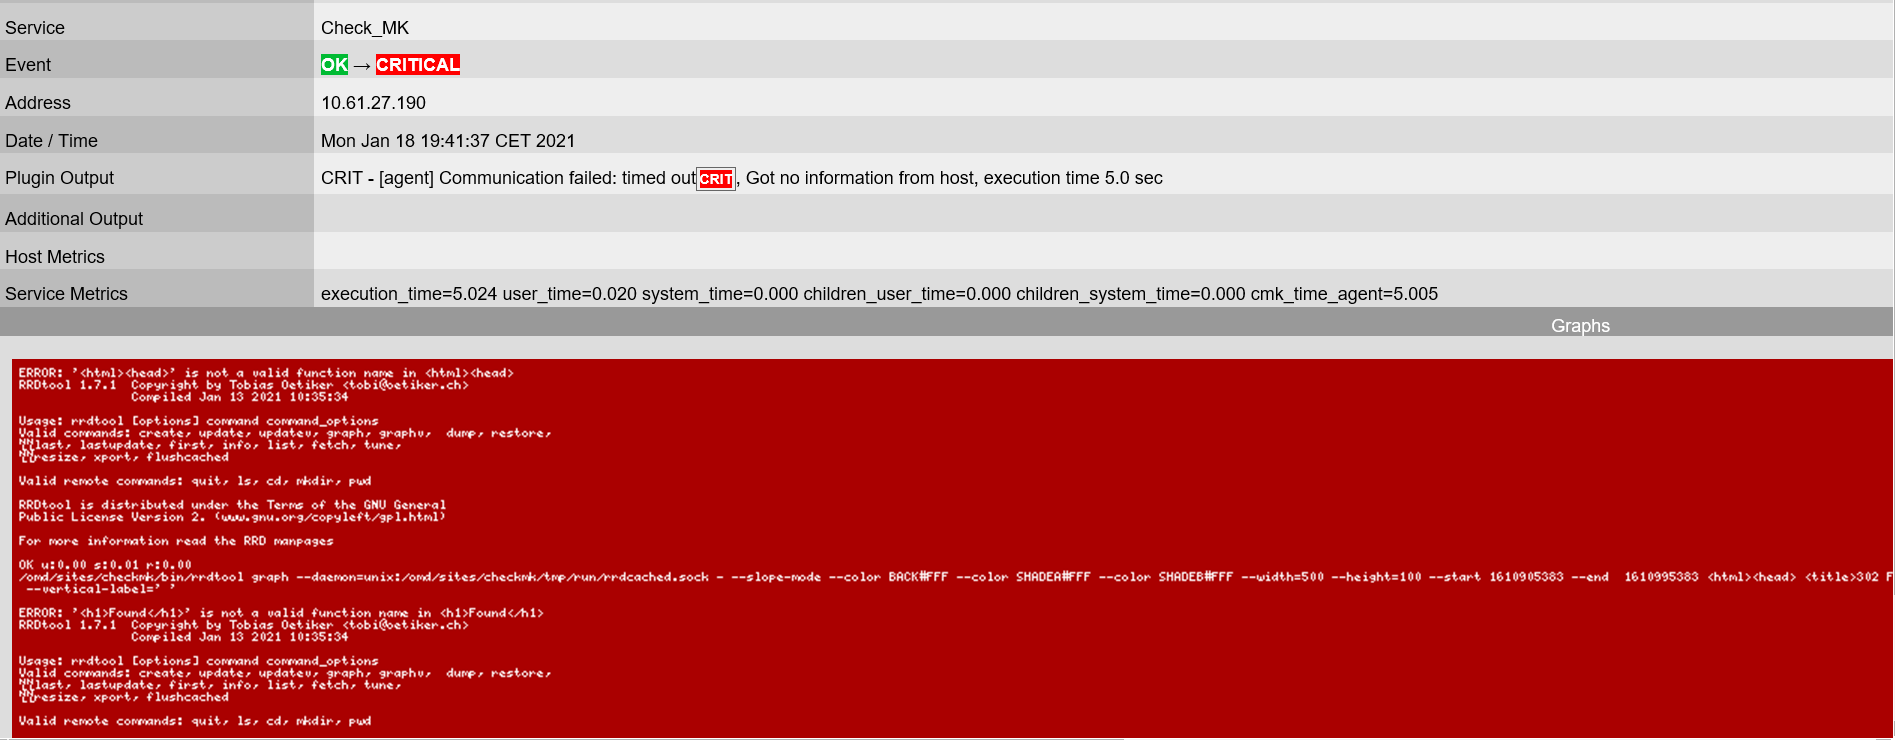
Thank you for the concern, I upgraded the raw version from 1.6 Op6 to 1.6 Op20 , but for sometime after the upgradation instead of red error the graphs were displayed for few servers but now again it has started coming for almost al the servers. For instance, for one of our host this is the error for checkmk service
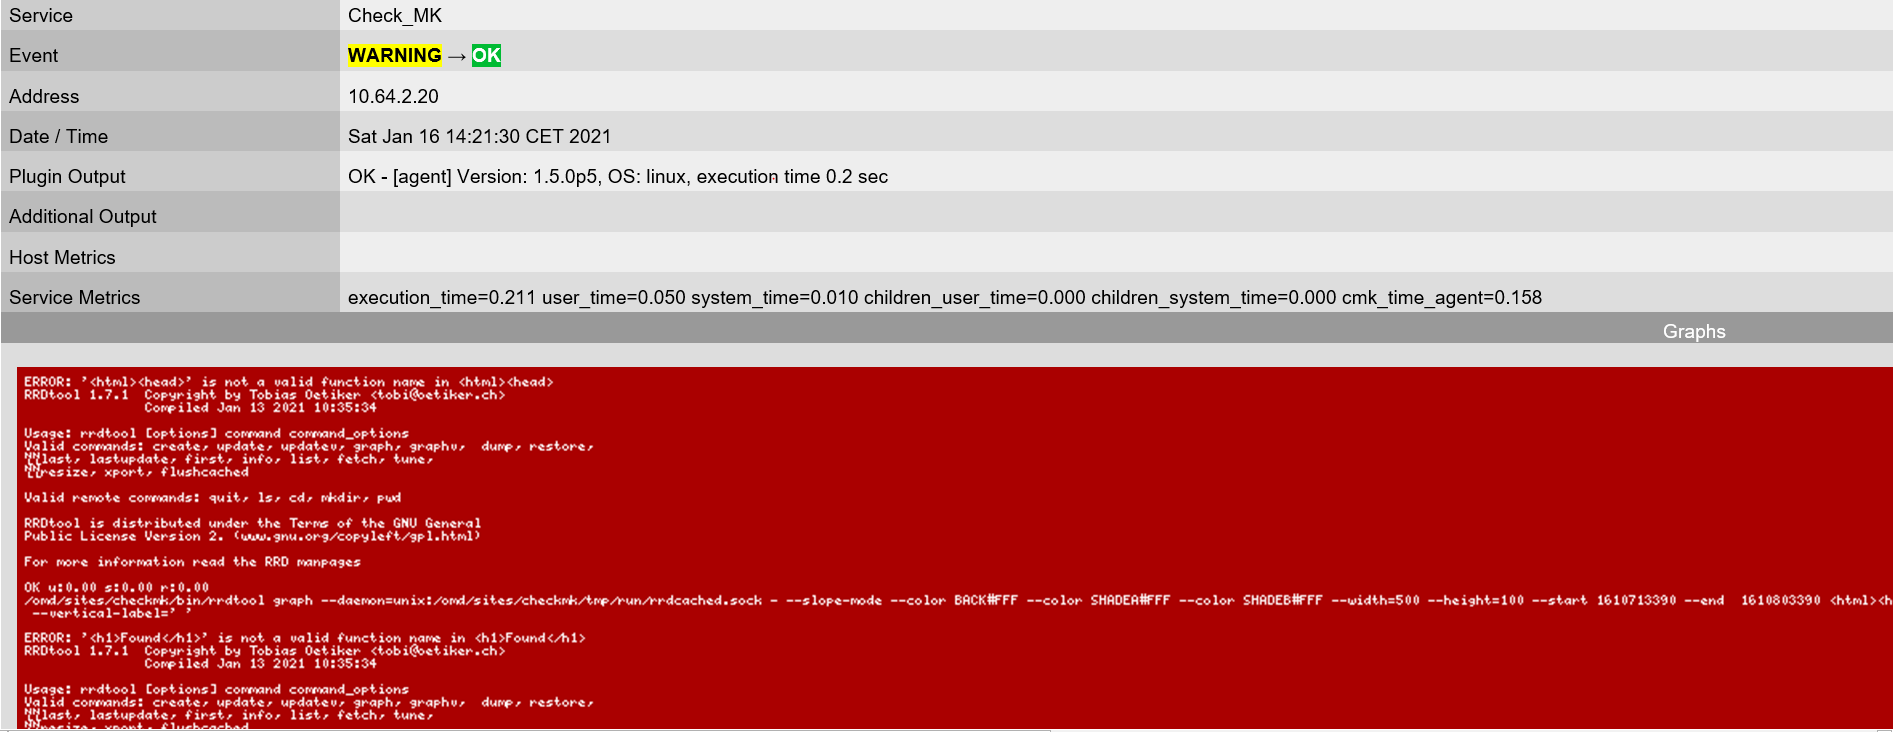
Now, If I go to pnp4nagios to get the graph , it is displayed correctly on GUI.
I think somewhere the rule is not properly configured for folder where we have the servers, not sure what goes wrong…there are n number of things…if we troubleshoot and take step by step…what is the first step to check this error.
Everything is displayed beautifully on gui but on email notifications this red box error is not going…
BR
/Prachi
The only thing what i would inspect is the mail template for the notification itself.
Was there some modification done? Is a file existing inside the folder “~/local/share/check_mk/notifications”? Something there is “corrupting” the code for the rrdtool call.
Hi @andreas-doehler,
We have the notification inside this path:
/opt/omd/sites/checkmk/local/share/check_mk/notifications
but I could see no file inside notifications
[root@sekatecheckmk ~]# cd /opt/omd/sites/checkmk/local/share/check_mk/
[root@sekatecheckmk check_mk]# ls
agents alert_handlers checkman checks inventory locale mibs notifications pnp-rraconf pnp-templates reporting web
[root@sekatecheckmk check_mk]# cd notifications/
[root@sekatecheckmk notifications]# ls
[root@sekatecheckmk notifications]#
BR
/Prachi
Can you do ? [root@sekatecheckmk ~]# find /opt/omd/sites/checkmk/local/share/*
Hi @anonymous15,
GoodMorning
Yes , tried the above command and I get so many files here:
[root@sekatecheckmk ~]# find /opt/omd/sites/checkmk/local/share/*
/opt/omd/sites/checkmk/local/share/check_mk
/opt/omd/sites/checkmk/local/share/check_mk/agents
/opt/omd/sites/checkmk/local/share/check_mk/agents/bakery
/opt/omd/sites/checkmk/local/share/check_mk/agents/linux
/opt/omd/sites/checkmk/local/share/check_mk/agents/linux/alert_handlers
/opt/omd/sites/checkmk/local/share/check_mk/agents/plugins
/opt/omd/sites/checkmk/local/share/check_mk/agents/special
/opt/omd/sites/checkmk/local/share/check_mk/alert_handlers
/opt/omd/sites/checkmk/local/share/check_mk/checkman
/opt/omd/sites/checkmk/local/share/check_mk/checks
/opt/omd/sites/checkmk/local/share/check_mk/inventory
/opt/omd/sites/checkmk/local/share/check_mk/mibs
/opt/omd/sites/checkmk/local/share/check_mk/notifications
/opt/omd/sites/checkmk/local/share/check_mk/pnp-rraconf
/opt/omd/sites/checkmk/local/share/check_mk/pnp-templates
/opt/omd/sites/checkmk/local/share/check_mk/reporting
/opt/omd/sites/checkmk/local/share/check_mk/reporting/images
/opt/omd/sites/checkmk/local/share/check_mk/web
/opt/omd/sites/checkmk/local/share/check_mk/web/htdocs
/opt/omd/sites/checkmk/local/share/check_mk/web/htdocs/images
/opt/omd/sites/checkmk/local/share/check_mk/web/htdocs/themes
/opt/omd/sites/checkmk/local/share/check_mk/web/plugins
/opt/omd/sites/checkmk/local/share/check_mk/web/plugins/config
/opt/omd/sites/checkmk/local/share/check_mk/web/plugins/dashboard
/opt/omd/sites/checkmk/local/share/check_mk/web/plugins/icons
/opt/omd/sites/checkmk/local/share/check_mk/web/plugins/metrics
/opt/omd/sites/checkmk/local/share/check_mk/web/plugins/pages
/opt/omd/sites/checkmk/local/share/check_mk/web/plugins/perfometer
/opt/omd/sites/checkmk/local/share/check_mk/web/plugins/sidebar
/opt/omd/sites/checkmk/local/share/check_mk/web/plugins/views
/opt/omd/sites/checkmk/local/share/check_mk/web/plugins/visuals
/opt/omd/sites/checkmk/local/share/check_mk/web/plugins/wato
/opt/omd/sites/checkmk/local/share/check_mk/locale
/opt/omd/sites/checkmk/local/share/diskspace
/opt/omd/sites/checkmk/local/share/doc
/opt/omd/sites/checkmk/local/share/doc/check_mk
/opt/omd/sites/checkmk/local/share/dokuwiki
/opt/omd/sites/checkmk/local/share/dokuwiki/htdocs
/opt/omd/sites/checkmk/local/share/nagios
/opt/omd/sites/checkmk/local/share/nagios/htdocs
/opt/omd/sites/checkmk/local/share/nagios/htdocs/theme
/opt/omd/sites/checkmk/local/share/nagios/htdocs/theme/stylesheets
/opt/omd/sites/checkmk/local/share/nagios/htdocs/theme/images
/opt/omd/sites/checkmk/local/share/nagvis
/opt/omd/sites/checkmk/local/share/nagvis/htdocs
/opt/omd/sites/checkmk/local/share/nagvis/htdocs/server
/opt/omd/sites/checkmk/local/share/nagvis/htdocs/server/core
/opt/omd/sites/checkmk/local/share/nagvis/htdocs/server/core/classes
/opt/omd/sites/checkmk/local/share/nagvis/htdocs/server/core/classes/objects
/opt/omd/sites/checkmk/local/share/nagvis/htdocs/userfiles
/opt/omd/sites/checkmk/local/share/nagvis/htdocs/userfiles/gadgets
/opt/omd/sites/checkmk/local/share/nagvis/htdocs/userfiles/images
/opt/omd/sites/checkmk/local/share/nagvis/htdocs/userfiles/images/iconsets
/opt/omd/sites/checkmk/local/share/nagvis/htdocs/userfiles/images/maps
/opt/omd/sites/checkmk/local/share/nagvis/htdocs/userfiles/images/shapes
/opt/omd/sites/checkmk/local/share/nagvis/htdocs/userfiles/scripts
/opt/omd/sites/checkmk/local/share/nagvis/htdocs/userfiles/styles
/opt/omd/sites/checkmk/local/share/nagvis/htdocs/userfiles/templates
/opt/omd/sites/checkmk/local/share/snmp
/opt/omd/sites/checkmk/local/share/snmp/mibs
BR
/Prachi
Can you also make sure that the agent on the linux host in your example also runs 1.6.0p20 ?
Hi @anonymous15,
here we go and now I feel confident in checkmk commands:
OMD[checkmk]:~$ omd config show
ADMIN_MAIL:
APACHE_MODE: own
APACHE_TCP_ADDR: 127.0.0.1
APACHE_TCP_PORT: 5000
AUTOSTART: on
CORE: nagios
LIVESTATUS_TCP: off
MKEVENTD: on
MKEVENTD_SNMPTRAP: off
MKEVENTD_SYSLOG: off
MKEVENTD_SYSLOG_TCP: off
MULTISITE_AUTHORISATION: on
MULTISITE_COOKIE_AUTH: on
NAGIOS_THEME: classicui
NSCA: off
PNP4NAGIOS: on
TMPFS: on
OMD[checkmk]:~$ omd version
OMD - Open Monitoring Distribution Version 1.6.0p20.cre
I didn’t meant this. You have to install checkmk agent 1.6.0p20 on sekatekickstart… Right now 1.5.0p5 is there.
Hey Hi ,
Is it??So how you corrected it?
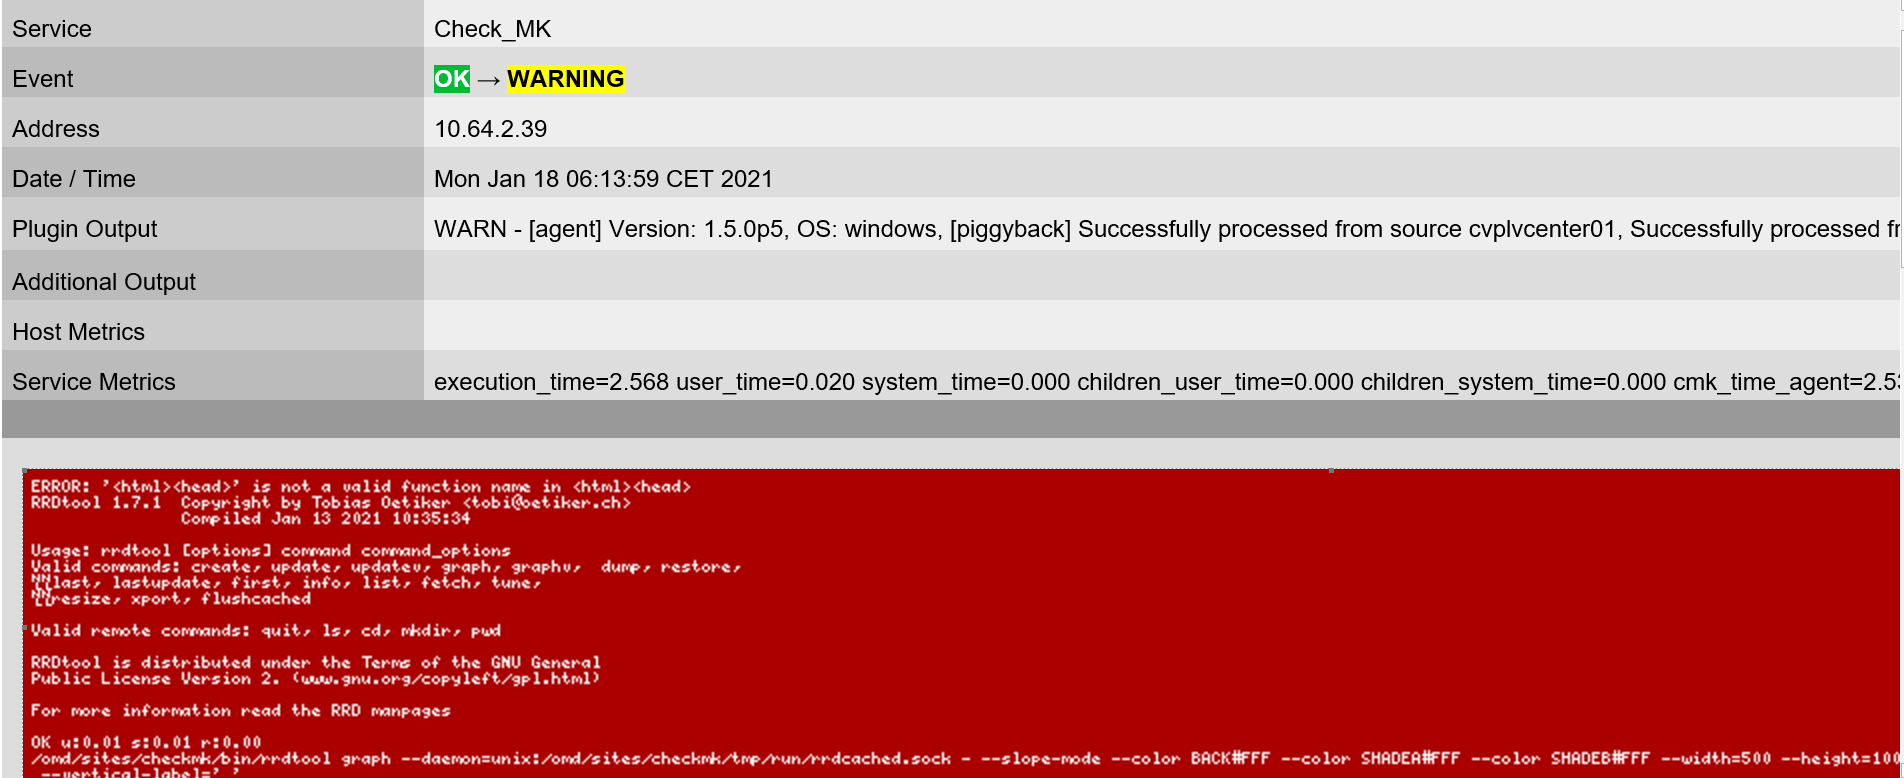
We also had number of change weekends during last few months, it always gives this red kind of error with Check_MK service and event up/down with no graphs displayed…only red box error
ok…but then there are around 500 hosts in our environment reporting to checkmk…so then I need to install this version in all the 500 hosts?
Hi @anonymous15,
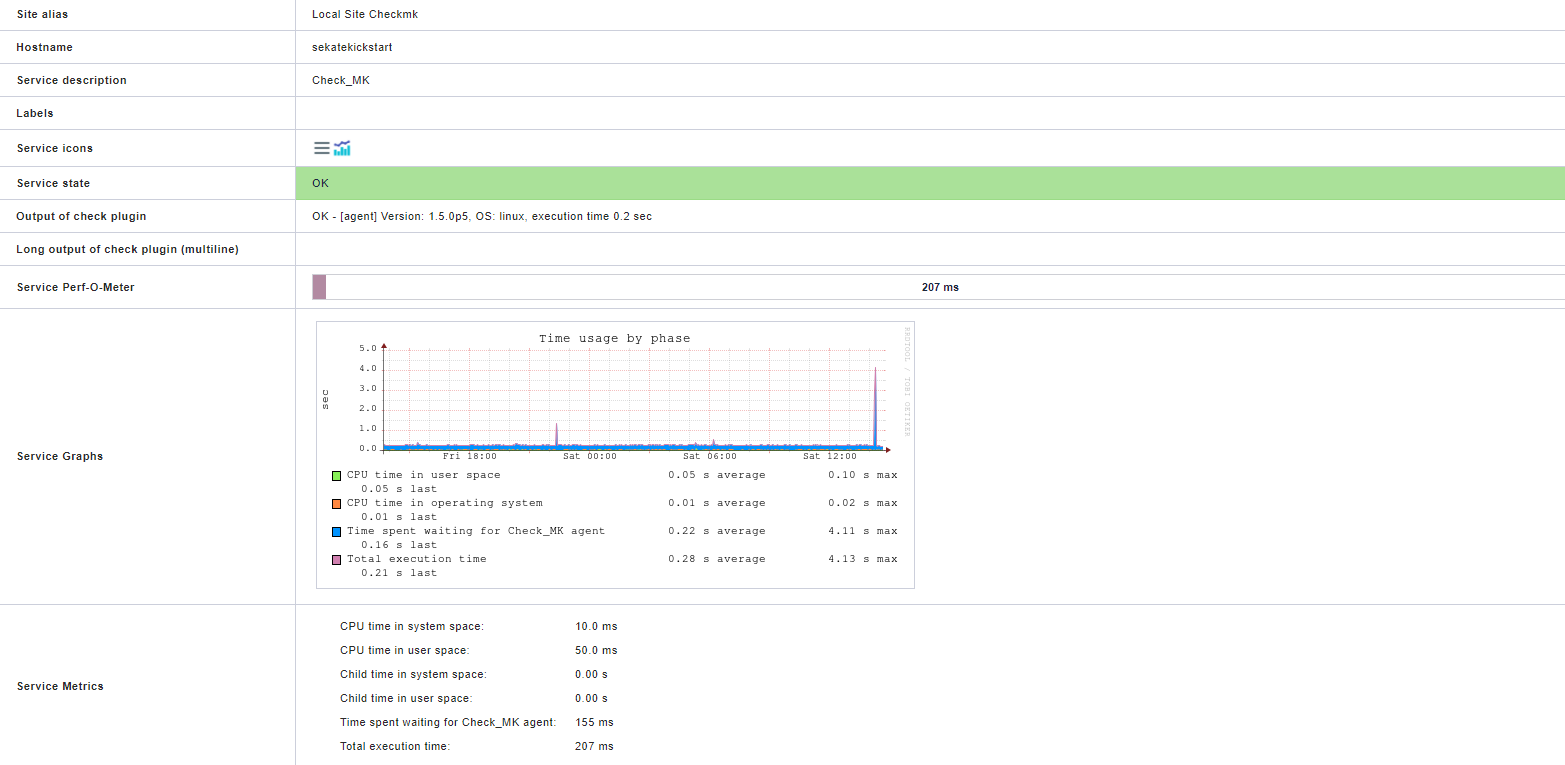
Created a test RHEL 7 VM and installed the new agent version 1.6 Op20 and discovered through Checkmk GUI
After sometime I powered off the VM to check the email notification, and it comes again with the same red error
Sorry, was caught up with other things. As a test,
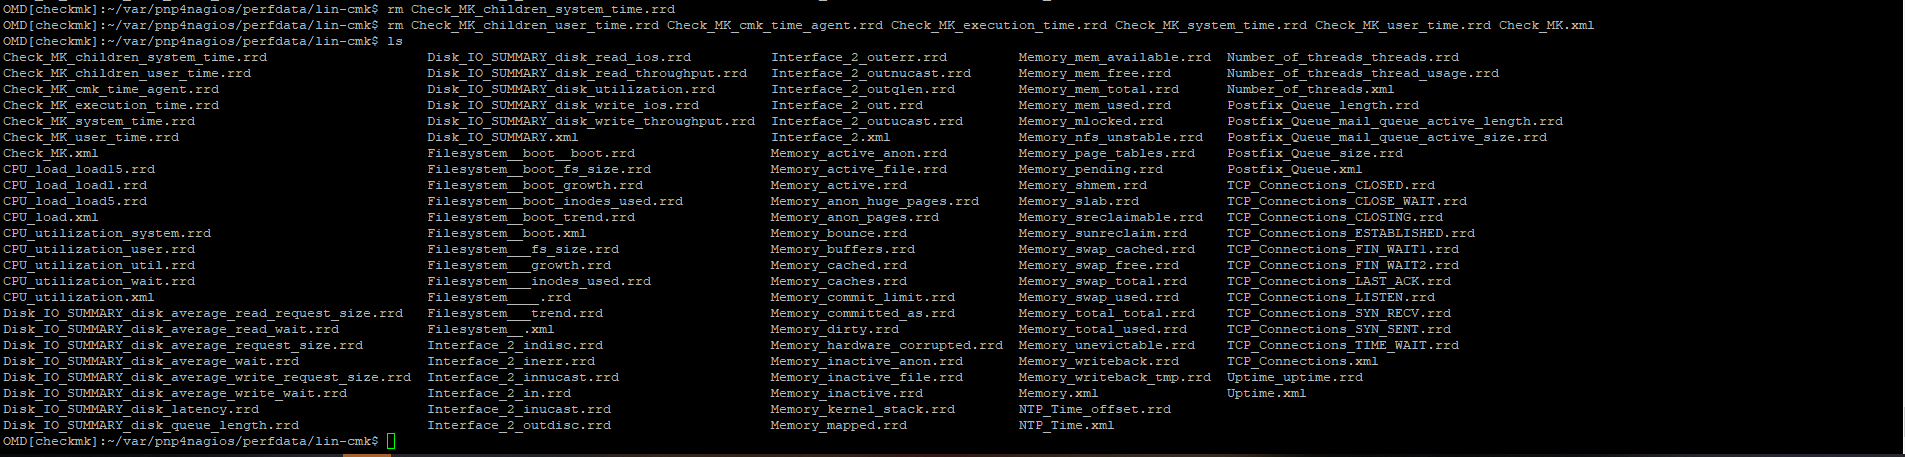
- can you login as site-user and then navigate to this folder:
~/var/pnp4nagios/perfdata//
Delete the rrd for the service Check_MK ?
which would be:
~/var/pnp4nagios/perfdata/localhost$ ls|grep Check_MK
Check_MK.xml
Check_MK_children_system_time.rrd
Check_MK_children_user_time.rrd
Check_MK_cmk_time_agent.rrd
Check_MK_execution_time.rrd
Check_MK_system_time.rrd
Check_MK_user_time.rrd
After this, do a omd restart followed by rescheduling the Check_MK service check on this host and try sending a forced/custom notification as a test for the service Check_MK and see if the error still persists in the notification ?
- Also, do you use a custom notification script or the standard “mail” script under ~/share/check_mk/notifications/ ?
- What about the messages in the notify.log,mknotifyd.log,rrdcached.log ? Is it still filled with the error messages you shared so far or any new messages?
Hi @anonymous15,
Logged in as site user and then tried deleting the rrd of checkmk service with the below command:
rm file1 file2
but after this ,just to check if the rrd is deleted and do ls, the deleted rrds come again.
I am confused are they deleted or not for the test host lin-cmk
-
Also, do you use a custom notification script or the standard “mail” script under ~/share/check_mk/notifications/ ?
We dont use a custom notification script , we have standard mail script
-
What about the messages in the notify.log,mknotifyd.log,rrdcached.log ? Is it still filled with the error messages you shared so far or any new messages?
In notify.log
2021-01-20 12:14:02 Sending out 3 ripe bulk notifications
2021-01-20 12:14:02 -> epkpej/mail /omd/sites/checkmk/var/check_mk/notify/bulk/epkpej/mail/60,1000,host,lin-cmk
2021-01-20 12:14:02 mail: Spooled mail to local mail transmission agent
2021-01-20 12:14:02 mail: Unable to fetch number of graphs: Unable to fetch graph infos:
XML file "/omd/sites/checkmk/var/pnp4nagios/perfdata/lin-cmk/HOST.xml" not found. <a href="http://docs.pnp4nagios.org/faq/6">Read FAQ online</a>
2021-01-20 12:14:02 -> epkgofr/mail /omd/sites/checkmk/var/check_mk/notify/bulk/epkgofr/mail/60,1000,host,lin-cmk
2021-01-20 12:14:03 mail: Spooled mail to local mail transmission agent
2021-01-20 12:14:03 mail: Unable to fetch number of graphs: Unable to fetch graph infos:
XML file "/omd/sites/checkmk/var/pnp4nagios/perfdata/lin-cmk/HOST.xml" not found. <a href="http://docs.pnp4nagios.org/faq/6">Read FAQ online</a>
2021-01-20 12:14:03 -> ekptaar/mail /omd/sites/checkmk/var/check_mk/notify/bulk/ekptaar/mail/60,1000,host,lin-cmk
2021-01-20 12:14:03 mail: Spooled mail to local mail transmission agent
2021-01-20 12:14:03 mail: Unable to fetch number of graphs: Unable to fetch graph infos:
XML file "/omd/sites/checkmk/var/pnp4nagios/perfdata/lin-cmk/HOST.xml" not found. <a href="http://docs.pnp4nagios.org/faq/6">Read FAQ online</a>
Nothing on rrdcached.log
BR
/Regards
Just wanted to be sure that this is not related to any kind of custom hack or corrupt RRD’s, as a test can you create a test site site on the same monitoring server and then see if the problem with the notification still exists ?
This is correct if the host is checked then a new rrd file is created in the moment new performance data will arrive. You can check these inside the web frontend with an empty graph or with only the first values on the right side.
I don’t know what the real problem is. It has something to do with the fetching of the graphs not directly with the graph files. (rrd’s)
As we tested before that all the graphs are shown correctly inside PNP4Nagios.
One thing what you can check is your php session path (~/tmp/php/session). The mail script uses the direct call of the PHP file ($OMDROOT$/share/pnp4nagios/htdocs/index.php) with some options to go around the authorization.
It is possible to manually issue this command to check if the graph is fetched correctly. I cannot give the correct syntax at the moment as i have no system at the hand to test ![]()