Hello folks,
(EDIT: I’m new here, hope this is the right forum. Feel free to redirect me to a more suitable location.)
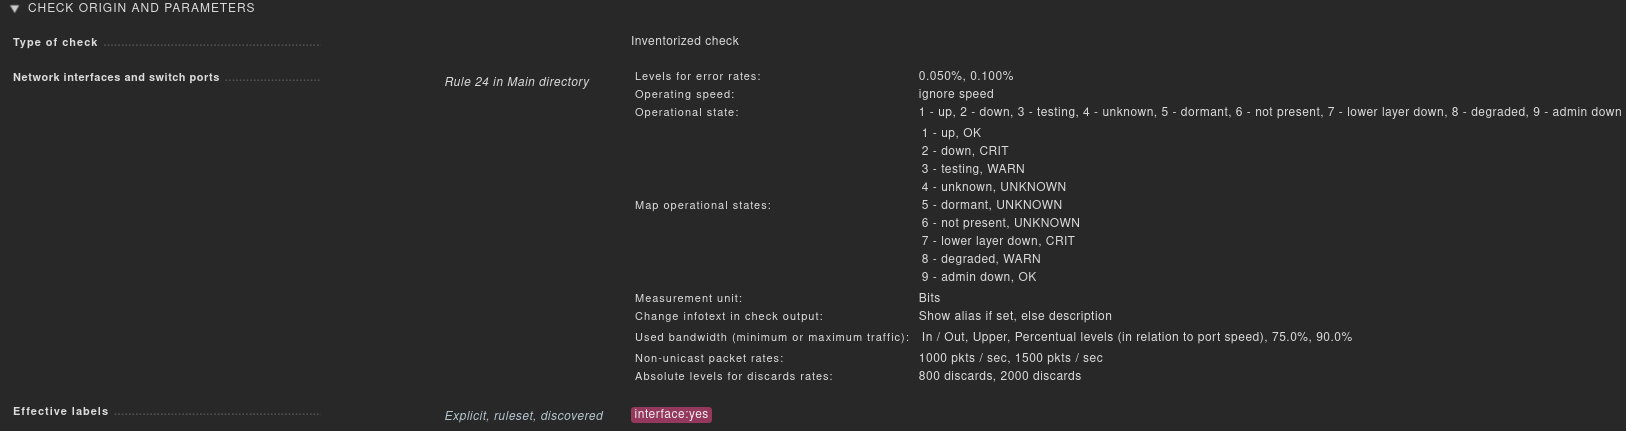
The state of an interface is reported as down even though it should be admin down (and admin down is mapped to the CMK state OK via rule).
Am I doing something wrong or misunderstanding something? If not, should I open a bugreport somewhere?
The following illustrates the state of the interface on the client. I ran the check again directly after the last command pasted here.
root@gitlab-ci0 ~ # ip l set dev eth0 up ; ip -j l sh dev eth0| jq
[
  {
    "ifindex": 2,
    "ifname": "eth0",
    "flags": [
      "NO-CARRIER",
      "BROADCAST",
      "MULTICAST",
      "UP"
    ],
    "mtu": 1500,
    "qdisc": "mq",
    "operstate": "DOWN",
    "linkmode": "DEFAULT",
    "group": "default",
    "txqlen": 1000,
    "link_type": "ether",
    "address": "00:1a:4a:74:cf:46",
    "broadcast": "ff:ff:ff:ff:ff:ff"
  }
]
root@gitlab-ci0 ~ # ip l set dev eth0 down ; ip -j l sh dev eth0| jq
[
  {
    "ifindex": 2,
    "ifname": "eth0",
    "flags": [
      "BROADCAST",
      "MULTICAST"
    ],
    "mtu": 1500,
    "qdisc": "mq",
    "operstate": "DOWN",
    "linkmode": "DEFAULT",
    "group": "default",
    "txqlen": 1000,
    "link_type": "ether",
    "address": "00:1a:4a:74:cf:46",
    "broadcast": "ff:ff:ff:ff:ff:ff"
  }
]
Full cmk output for the host:
[cpu_tracking] Start with phase 'busy'                                                                                                                                                                                                [1/3874]
Check_MK version 1.6.0p19
Try aquire lock on /omd/sites/monitoring/tmp/check_mk/counters/gitlab-ci0.agdsn.network
Got lock on /omd/sites/monitoring/tmp/check_mk/counters/gitlab-ci0.agdsn.network
Releasing lock on /omd/sites/monitoring/tmp/check_mk/counters/gitlab-ci0.agdsn.network
Released lock on /omd/sites/monitoring/tmp/check_mk/counters/gitlab-ci0.agdsn.network
Loading autochecks from /omd/sites/monitoring/var/check_mk/autochecks/gitlab-ci0.agdsn.network.mk
+ FETCHING DATA
[cpu_tracking] Push phase 'ds' (Stack: ['busy'])
 [agent] No persisted sections loaded
 [agent] Not using cache (Don't try it)
 [agent] Execute data source
 [agent] Calling external program u'ssh -o PasswordAuthentication=no -o KbdInteractiveAuthentication=no -o StrictHostKeyChecking=no -o VerifyHostKeyDNS=yes -i ~/etc/check_mk/id_rsa -l root 10.128.1.3 check_mk_agent'
 [agent] Write data to cache file /omd/sites/monitoring/tmp/check_mk/cache/gitlab-ci0.agdsn.network
Try aquire lock on /omd/sites/monitoring/tmp/check_mk/cache/gitlab-ci0.agdsn.network
Got lock on /omd/sites/monitoring/tmp/check_mk/cache/gitlab-ci0.agdsn.network
Releasing lock on /omd/sites/monitoring/tmp/check_mk/cache/gitlab-ci0.agdsn.network
Released lock on /omd/sites/monitoring/tmp/check_mk/cache/gitlab-ci0.agdsn.network
[cpu_tracking] Pop phase 'ds' (Stack: ['busy', 'ds'])
[cpu_tracking] Push phase 'agent' (Stack: ['busy'])
 [piggyback] No persisted sections loaded
 [piggyback] Execute data source
No piggyback files for 'gitlab-ci0.agdsn.network'. Skip processing.
No piggyback files for '10.128.1.3'. Skip processing.
[cpu_tracking] Pop phase 'agent' (Stack: ['busy', 'agent'])
CPU load             OK - 15 min load: 0.26 at 4 Cores (0.07 per Core)
CPU utilization      OK - User: 5.83%, System: 8.03%, Wait: 0%, Steal: 0.31%, Total CPU: 14.17%
[… irrelevant checks skipped …]
Interface eth0       CRIT - [eth0](down)(!!) MAC: 00:1A:4A:74:CF:46, speed unknown
Interface eth1       OK - [eth1](up) MAC: 00:1A:4A:74:CF:47, speed unknown, In: 0 bit/s, in non-unicast packets 0.00/s, in discards 0.00/s, Out: 0 bit/s, out non-unicast packets 0.00/s, out discards 0.00/s
Interface eth2       OK - [eth2](up) MAC: 00:1A:4A:74:CF:83, speed unknown, In: 400.76 kbit/s, in non-unicast packets 0.00/s, in discards 0.00/s, Out: 998.3 kbit/s, out non-unicast packets 0.00/s, out discards 0.00/s
Interface lo         OK - [lo](up) speed unknown, In: 0 bit/s, in non-unicast packets 0.00/s, in discards 0.00/s, Out: 0 bit/s, out non-unicast packets 0.00/s, out discards 0.00/s
[… irrelevant checks skipped …]
+ EXECUTING INVENTORY PLUGINS
Plugins: check_mk lnx_if mem
[cpu_tracking] End
OK - [agent] Version: 1.6.0p19, OS: linux, execution time 1.1 sec | execution_time=1.051 user_time=0.160 system_time=0.010 children_user_time=0.050 children_system_time=0.010 cmk_time_ds=0.825 cmk_time_agent=0.001
Relevant WATO section: