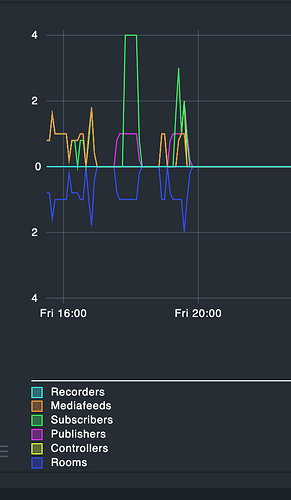
However, I’m still not very happy with the averaging and the min and max… Those values are counters, the curves should be pure digital curves, not having any math applied.
For instance this query (as far as I understand it) delivers the numbers accounted for metric “room”. An integer counter.
I’m testing “rooms” for the time of yesterday, Fr 24.2. 16:00 UTC to 20:00 UTC:
lq "GET services\nFilter: host_name = my-server\nFilter: service_description = my-description\nColumns: host_name\nColumns: service_description\nColumns: rrddata:m1:rooms,1,*:1677254400:1677268800:60\nOutputFormat: python"
I’m getting:
[[u"my-server",u"my-description",[1677254400,1677268800,60,1,1,1,1,1,0.2,0,0,0,0,0,0,0.8,0.2,0,0,0,0.8,0.2,0,0,0,0,0,0.8,1,1,1,1,1,1,1,1,1,0.2,0,0,0,0,0,0,0.8,0.2,0.8,1,1,0.2,0.8,1,1.8,0.4,0,0,0,0,0,0,0,0,0,0,0,0,0,0,0,0,0,0,0,0,0,0,0,0,0,0,0,0,0,0,0,0,0,0,0,0,0,0,0,0,0,0,0,0.8,1,1,1,1,1,1,1,1,1,1,1,1,1,1,1,1,1,1,1,1,1,1,1,1,1,1,1,1,1,1,1,1,1,1,1,0.2,0,0,0,0,0,0,0,0,0,0,0,0,0,0,0,0,0,0,0,0,0,0,0,0,0,0,0,0,0,0,0,0,0,0,0,0,0,0,0,0,0,0,0.8,1,1,0.2,0,0,0,0,0,0,0,0,0,0,0,0,0.8,1,1,1,1,1,1,1,1,1,1,1,1,1,1,1,1,1,1,1,1,1.8,2,0.4,0.8,1,1,1,1,1,1,0.2,0,0,0,0,0,0,0,0,0,0,0,0,0,0,0,0,0,0,0]]]
The “0.4, 0.2, 0.8” - well - would “pure mathematical nonsense” describe those values ? ![]()
This is the graph. I’m desperately trying to get rid of all these “mins/max/averages” to no avail so far.
