Invalid JSON exported from graph

CMK version: Checkmk Raw Edition 2.1.0p20
OS version: Mac OS Ventura

The JSON exported from this menu is invalid, both in CSV and JSON variant.

If I interpret it correctly, then the export just wraps some function called cmk.graphs.load_graph_content, which seemingly has JSON as parameter. I have not checked, if the function itself can cope with it, but carving the JSON (JS) out of the function and putting it into jsonlint or something shows errors.

In addition it is not clear to me, what the purpose of this export is, because nothing in it exports any useful data.

The export is only exporting the table as csv or json. For the graph data you need to make a query with livestatus or with the API.
I only made these requests with livestatus.
There is also a KB how to get the history metrics.
https://kb.checkmk.com/display/KB/Query+historical+metrics

If you want to export the data in the graph just click on the “hamburger” menu to the left of the graph and scroll down to the botton where you have export to json.

If will contain “rrddata” for all the metrics in the graph but no units so you have to figure that out.

Thanks. That “lg” query looks interesting. Couldn’t make it run to just return “my service” data.

EDIT: Works

This has no export item, just options to place it to a dashboard.

However, I’m still not very happy with the averaging and the min and max… Those values are counters, the curves should be pure digital curves, not having any math applied.

For instance this query (as far as I understand it) delivers the numbers accounted for metric “room”. An integer counter.

I’m testing “rooms” for the time of yesterday, Fr 24.2. 16:00 UTC to 20:00 UTC:

lq "GET services\nFilter: host_name = my-server\nFilter: service_description = my-description\nColumns: host_name\nColumns: service_description\nColumns: rrddata:m1:rooms,1,*:1677254400:1677268800:60\nOutputFormat: python"

I’m getting:

[[u"my-server",u"my-description",[1677254400,1677268800,60,1,1,1,1,1,0.2,0,0,0,0,0,0,0.8,0.2,0,0,0,0.8,0.2,0,0,0,0,0,0.8,1,1,1,1,1,1,1,1,1,0.2,0,0,0,0,0,0,0.8,0.2,0.8,1,1,0.2,0.8,1,1.8,0.4,0,0,0,0,0,0,0,0,0,0,0,0,0,0,0,0,0,0,0,0,0,0,0,0,0,0,0,0,0,0,0,0,0,0,0,0,0,0,0,0,0,0,0,0.8,1,1,1,1,1,1,1,1,1,1,1,1,1,1,1,1,1,1,1,1,1,1,1,1,1,1,1,1,1,1,1,1,1,1,1,0.2,0,0,0,0,0,0,0,0,0,0,0,0,0,0,0,0,0,0,0,0,0,0,0,0,0,0,0,0,0,0,0,0,0,0,0,0,0,0,0,0,0,0,0.8,1,1,0.2,0,0,0,0,0,0,0,0,0,0,0,0,0.8,1,1,1,1,1,1,1,1,1,1,1,1,1,1,1,1,1,1,1,1,1.8,2,0.4,0.8,1,1,1,1,1,1,0.2,0,0,0,0,0,0,0,0,0,0,0,0,0,0,0,0,0,0,0]]]

The “0.4, 0.2, 0.8” - well - would “pure mathematical nonsense” describe those values ? :slight_smile:

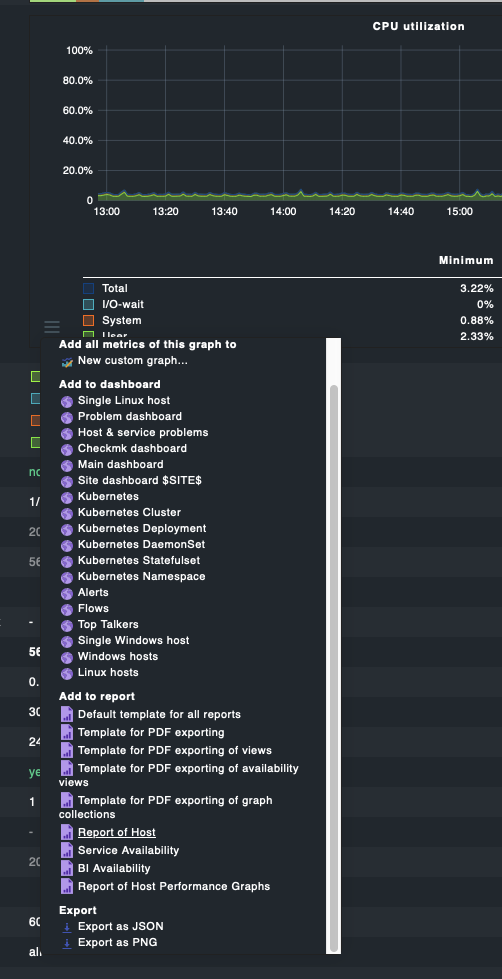
This is the graph. I’m desperately trying to get rid of all these “mins/max/averages” to no avail so far.

OK perhaps this is an enterprise feature. In that case you have to either use the API or use as @andreas-doehler recommended and use Livestatus

This is what I have

I would say that this is no nonsense. It is more a problem how data is stored inside the RRD file.
For your use case, i would recommend, that you change the storage properties for this check.
A extended description how the data is stored and consolidated over time you can find here.

For your problem i would recommend the articles “Rates, normalizing and consolidating” and “Minimum, average and maximum”.
Your graph example is already consolidated and this gives you the point numbers.
Without consolidation the “MAX” value should show every time integer numbers.

Oh, thanks. I will check this out. This will probably finally solve my issue.

I would say that this is no nonsense. It is more a problem how data is stored inside the RRD file.

Don’t get offended please. I was just kidding :slight_smile:

Immediate question as follow up: How could I do that?

EDIT: If this is the way to go Measured values and graphing - Evaluating measured values in Checkmk quickly and easily then I suppose I would have to upgrade to some enterprise version (?)

EDIT 2: rrdtool? Found several *.rrd files in ~/var/pnp4nagios/perfdata/my-server. One for each metric. Full of cryptic stuff :slight_smile:

EDIT 3: rrdtools info service_name_rooms.rrd, for instance, shows a lot of stuff:

filename = "service_name_rooms.rrd"
rrd_version = "0003"
step = 60
last_update = 1677349452
header_size = 2872
ds[1].index = 0
ds[1].type = "GAUGE"
ds[1].minimal_heartbeat = 8460
ds[1].min = NaN
ds[1].max = NaN
ds[1].last_ds = "0"
ds[1].value = 0.0000000000e+00
ds[1].unknown_sec = 0
rra[0].cf = "AVERAGE"
rra[0].rows = 2880
rra[0].cur_row = 2572
rra[0].pdp_per_row = 1
rra[0].xff = 5.0000000000e-01
rra[0].cdp_prep[0].value = NaN
rra[0].cdp_prep[0].unknown_datapoints = 0
rra[1].cf = "AVERAGE"
rra[1].rows = 2880
rra[1].cur_row = 1788
rra[1].pdp_per_row = 5
rra[1].xff = 5.0000000000e-01
rra[1].cdp_prep[0].value = 0.0000000000e+00
rra[1].cdp_prep[0].unknown_datapoints = 0
rra[2].cf = "AVERAGE"
rra[2].rows = 4320
rra[2].cur_row = 495
rra[2].pdp_per_row = 30
rra[2].xff = 5.0000000000e-01
rra[2].cdp_prep[0].value = 0.0000000000e+00
rra[2].cdp_prep[0].unknown_datapoints = 0
rra[3].cf = "AVERAGE"
rra[3].rows = 5840
rra[3].cur_row = 93
rra[3].pdp_per_row = 360
rra[3].xff = 5.0000000000e-01
rra[3].cdp_prep[0].value = 0.0000000000e+00
rra[3].cdp_prep[0].unknown_datapoints = 0
rra[4].cf = "MAX"
rra[4].rows = 2880
rra[4].cur_row = 493
rra[4].pdp_per_row = 1
rra[4].xff = 5.0000000000e-01
rra[4].cdp_prep[0].value = NaN
rra[4].cdp_prep[0].unknown_datapoints = 0
rra[5].cf = "MAX"
rra[5].rows = 2880
rra[5].cur_row = 270
rra[5].pdp_per_row = 5
rra[5].xff = 5.0000000000e-01
rra[5].cdp_prep[0].value = 0.0000000000e+00
rra[5].cdp_prep[0].unknown_datapoints = 0
rra[6].cf = "MAX"
rra[6].rows = 4320
rra[6].cur_row = 2820
rra[6].pdp_per_row = 30
rra[6].xff = 5.0000000000e-01
rra[6].cdp_prep[0].value = 0.0000000000e+00
rra[6].cdp_prep[0].unknown_datapoints = 0
rra[7].cf = "MAX"
rra[7].rows = 5840
rra[7].cur_row = 2352
rra[7].pdp_per_row = 360
rra[7].xff = 5.0000000000e-01
rra[7].cdp_prep[0].value = 0.0000000000e+00
rra[7].cdp_prep[0].unknown_datapoints = 0
rra[8].cf = "MIN"
rra[8].rows = 2880
rra[8].cur_row = 2077
rra[8].pdp_per_row = 1
rra[8].xff = 5.0000000000e-01
rra[8].cdp_prep[0].value = NaN
rra[8].cdp_prep[0].unknown_datapoints = 0
rra[9].cf = "MIN"
rra[9].rows = 2880
rra[9].cur_row = 68
rra[9].pdp_per_row = 5
rra[9].xff = 5.0000000000e-01
rra[9].cdp_prep[0].value = 0.0000000000e+00
rra[9].cdp_prep[0].unknown_datapoints = 0
rra[10].cf = "MIN"
rra[10].rows = 4320
rra[10].cur_row = 4029
rra[10].pdp_per_row = 30
rra[10].xff = 5.0000000000e-01
rra[10].cdp_prep[0].value = 0.0000000000e+00
rra[10].cdp_prep[0].unknown_datapoints = 0
rra[11].cf = "MIN"
rra[11].rows = 5840
rra[11].cur_row = 4228
rra[11].pdp_per_row = 360
rra[11].xff = 5.0000000000e-01
rra[11].cdp_prep[0].value = 0.0000000000e+00
rra[11].cdp_prep[0].unknown_datapoints = 0

I have the feeling, changes would have to be made here and then “updated”. Just how, is the question…

So that was pretty much a fail. I asked ChatGPT, how I could achieve this with the “other” consolidation. The answer was

a) save the old RRD files
b) rrdtool dump the old files
c) create a new one with other rules
d) rrdtool restore

So (for example) for the rooms metric (of course for all others too) I was doing this:

b) rrdtool dump KMS_Statistics_rooms.rrd > KMS_Statistics_rooms_old.xml
c) rrdtool create KMS_Statistics_rooms.rrd --start 1677393837 --step 60 DS:data_source_name:GAUGE:120:U:U RRA:AVERAGE:0.5:1:525600
d) rrdtool restore KMS_Statistics_rooms_old.xml KMS_Statistics_rooms.rrd

Step d) failed with “file already exists”. Attempting “–force” failed with “parameter not known”. Ok, I was ready go drop the old content, but in fact the GUI spit an error, that there where no “rrd data to create the graph”. In the end I just restored the files from step a) and all was as it was.

Some pointers pretty much appreciated.

Migrating existing data is not user friendly.
Your output of the “rrdtools info” command looks good. You have only one datasource (ds) and this datasource with 12 RRAs (RoundRobinArchive).
For your setup to store only the MAX values without consolidation you first need to define how-long do you want to store this data and with what time interval for one step.
The default value for 1 step is 1 minute.
One month without consolidation would need around 45000 datapoints. (60min * 24h * 31 days)

The running setup uses around 47000 datapoints to store data for 4 years.
Biggest difference here is that the data is stored in more than one RRA and every RRA has it’s own settings for consolidation.

From the output

rra[0].cf = "AVERAGE"
rra[0].rows = 2880
rra[0].cur_row = 2572
rra[0].pdp_per_row = 1     <-- 1 datapoint per step
rra[0].xff = 5.0000000000e-01
rra[0].cdp_prep[0].value = NaN
rra[0].cdp_prep[0].unknown_datapoints = 0
rra[1].cf = "AVERAGE"
rra[1].rows = 2880
rra[1].cur_row = 1788
rra[1].pdp_per_row = 5     <--- 1 datapoint every 5 steps (minutes)
rra[1].xff = 5.0000000000e-01
rra[1].cdp_prep[0].value = 0.0000000000e+00
rra[1].cdp_prep[0].unknown_datapoints = 0

Now the system takes 5 datapoints from rra[0] and consolidate it to one datapoint inside rra[1]. That is where you floating point numbers come from.

For the whole handling inside CMK you cannot manually create RRD files. These files are manage in case of the RAW edition by PNP4Nagios and inside the enterprise edition from the cmc core.

Well, ok. Thanks. But you said

For your use case, i would recommend, that you change the storage properties for this check.

I’m absolutely not clear, how I could “change” these properties.

I will try to describe tomorrow how this can be done. It is a little bit complicated and i need a system with raw edition for this :wink:

Here are some details for the modification of the RRD storage for the RAW edition.
Inside your site you find the folder ~/etc/pnp4nagios/check_commands. In this folder you can define templates for single commands how to handle performance data.
If PNP4Nagios finds a template file for your check command then it also looks for a file with name “template_name.rra.cfg” inside ~/etc/pnp4nagios/ and uses this definition to create the RRDs.
I thinks this procedure is really complicated for RAW edition. Inside enterprise edition you can define this RRA settings for every check inside the web GUI.
It is some years since i last changed these files manually :slight_smile:

All the code that handles this config files are inside “process_perfdata.pl” used by PNP4Nagios to write the performance data to RRD files.

Weird. Thanks anyway :confused:

Tried your suggestion in many ways. None of it worked.

I’m now on the enterprise free edition and I’m still having problems to achieve what I want. I see I can manipulate the graph. I can also define rules for the RRDs (Q: how to define a rule specifically for a check?). But I’m still getting the aggregation math applied to the discrete values.

I really like that, but not in this particular case. How can I get rid of it and have my values displayed as discrete, non-aggregated values (for this local check only, of course)?

I will try to make a small example with the enterprise settings.

Thanks in advance

Regards