Have you been able to create such a sample?
Sorry here my small example with the RRD creation rule for a single service.
Demo host
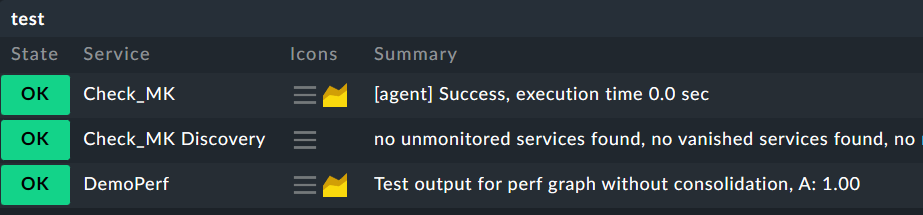
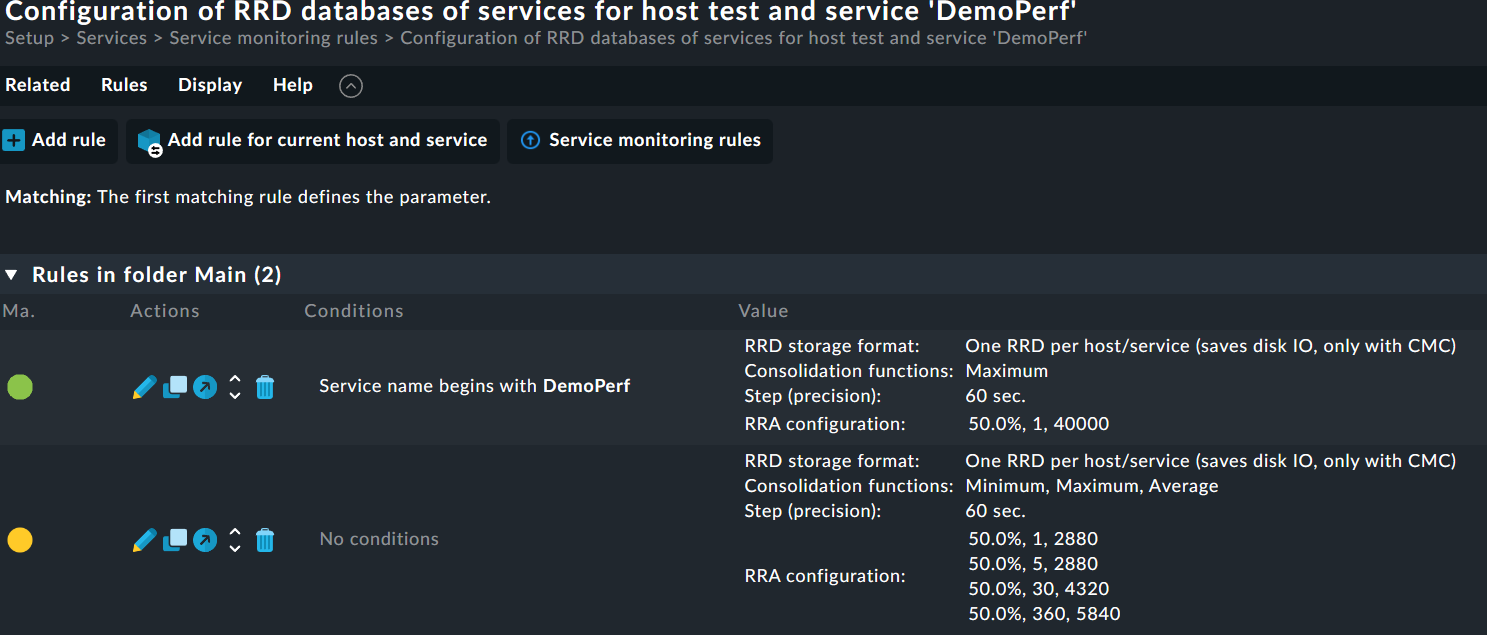
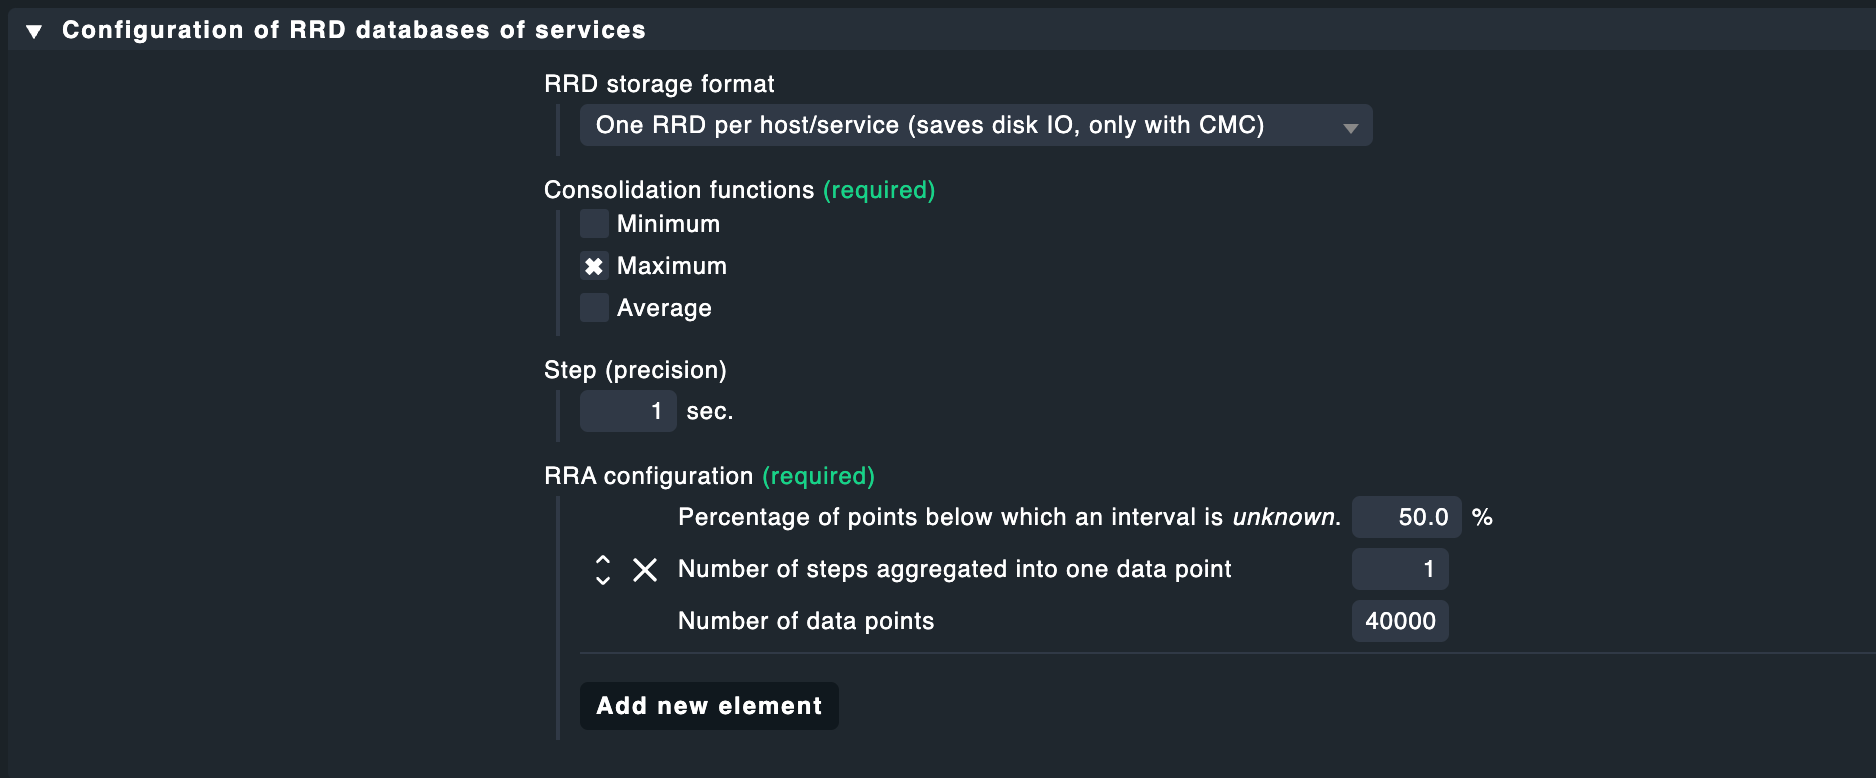
RRD rule
The 40k data points are history for ca. 28 days.
After you defined this rule stop your site. Go to ~/var/check_mk/rrd//
Delete if it exists all files with the name of your check - in my example all files with “DemoPerf” in name.
Go to ~/var/rrdcached/ - remove the old cache files - attention all data not written to disk at this moment will get lost. Normally rrdcached only writes one time per hours the data to disk.
Start the site.
Now inside ~/var/check_mk/rrd// you should see the files deleted before, recreated.
I checked now with rrdinfo if my setting is respected.
~/var/check_mk/rrd/test$ rrdinfo DemoPerf.rrd
filename = "DemoPerf.rrd"
rrd_version = "0003"
step = 60
last_update = 1678105811
header_size = 584
ds[1].index = 0
ds[1].type = "GAUGE"
ds[1].minimal_heartbeat = 8460
ds[1].min = NaN
ds[1].max = NaN
ds[1].last_ds = "1"
ds[1].value = 1.0000000000e+01
ds[1].unknown_sec = 1
rra[0].cf = "MAX"
rra[0].rows = 40000
rra[0].cur_row = 20554
rra[0].pdp_per_row = 1
rra[0].xff = 5.0000000000e-01
rra[0].cdp_prep[0].value = NaN
rra[0].cdp_prep[0].unknown_datapoints = 0
looks good 40k data points and last value was 1.
File size for one month and one minute resolution would be around 350kbyte.
1 Like
Cool. Thanks. Will give it a try later the day
Regards
Hmm. Does not really work for me.
This is my new rule:

The old RRD files and cached files have been removed. After restarting the site, there are new files in the rrd folder:
Size matches. Info not, since I still have Average and Min in.
filename = "KMS_Statistics.rrd"
rrd_version = "0003"
step = 60
last_update = 1678123238
header_size = 2872
ds[1].index = 0
ds[1].type = "GAUGE"
ds[1].minimal_heartbeat = 8460
ds[1].min = NaN
ds[1].max = NaN
ds[1].last_ds = "0"
ds[1].value = 0.0000000000e+00
ds[1].unknown_sec = 28
rra[0].cf = "AVERAGE"
rra[0].rows = 2880
rra[0].cur_row = 627
rra[0].pdp_per_row = 1
rra[0].xff = 5.0000000000e-01
rra[0].cdp_prep[0].value = NaN
rra[0].cdp_prep[0].unknown_datapoints = 0
rra[1].cf = "AVERAGE"
rra[1].rows = 4320
rra[1].cur_row = 2009
rra[1].pdp_per_row = 30
rra[1].xff = 5.0000000000e-01
rra[1].cdp_prep[0].value = NaN
rra[1].cdp_prep[0].unknown_datapoints = 20
rra[2].cf = "AVERAGE"
rra[2].rows = 5840
rra[2].cur_row = 4696
rra[2].pdp_per_row = 360
rra[2].xff = 5.0000000000e-01
rra[2].cdp_prep[0].value = NaN
rra[2].cdp_prep[0].unknown_datapoints = 320
rra[3].cf = "AVERAGE"
rra[3].rows = 2880
rra[3].cur_row = 260
rra[3].pdp_per_row = 5
rra[3].xff = 5.0000000000e-01
rra[3].cdp_prep[0].value = NaN
rra[3].cdp_prep[0].unknown_datapoints = 0
rra[4].cf = "MAX"
rra[4].rows = 2880
rra[4].cur_row = 1855
rra[4].pdp_per_row = 1
rra[4].xff = 5.0000000000e-01
rra[4].cdp_prep[0].value = NaN
rra[4].cdp_prep[0].unknown_datapoints = 0
rra[5].cf = "MAX"
rra[5].rows = 4320
rra[5].cur_row = 4091
rra[5].pdp_per_row = 30
rra[5].xff = 5.0000000000e-01
rra[5].cdp_prep[0].value = NaN
rra[5].cdp_prep[0].unknown_datapoints = 20
rra[6].cf = "MAX"
rra[6].rows = 5840
rra[6].cur_row = 2525
rra[6].pdp_per_row = 360
rra[6].xff = 5.0000000000e-01
rra[6].cdp_prep[0].value = NaN
rra[6].cdp_prep[0].unknown_datapoints = 320
rra[7].cf = "MAX"
rra[7].rows = 2880
rra[7].cur_row = 1045
rra[7].pdp_per_row = 5
rra[7].xff = 5.0000000000e-01
rra[7].cdp_prep[0].value = NaN
rra[7].cdp_prep[0].unknown_datapoints = 0
rra[8].cf = "MIN"
rra[8].rows = 2880
rra[8].cur_row = 2775
rra[8].pdp_per_row = 1
rra[8].xff = 5.0000000000e-01
rra[8].cdp_prep[0].value = NaN
rra[8].cdp_prep[0].unknown_datapoints = 0
rra[9].cf = "MIN"
rra[9].rows = 4320
rra[9].cur_row = 1986
rra[9].pdp_per_row = 30
rra[9].xff = 5.0000000000e-01
rra[9].cdp_prep[0].value = NaN
rra[9].cdp_prep[0].unknown_datapoints = 20
rra[10].cf = "MIN"
rra[10].rows = 5840
rra[10].cur_row = 620
rra[10].pdp_per_row = 360
rra[10].xff = 5.0000000000e-01
rra[10].cdp_prep[0].value = NaN
rra[10].cdp_prep[0].unknown_datapoints = 320
rra[11].cf = "MIN"
rra[11].rows = 2880
rra[11].cur_row = 780
rra[11].pdp_per_row = 5
rra[11].xff = 5.0000000000e-01
rra[11].cdp_prep[0].value = NaN
rra[11].cdp_prep[0].unknown_datapoints = 0
Also I’m missing these yellow and green dots (which I admittedly also have seen a while ago)
Wait. I have overseen, that my service returns KMS Statistics. The underscore has been produced by the RRT creator. Now I have a similar rrdinfo as you.
Let’s see, if I get what I want.
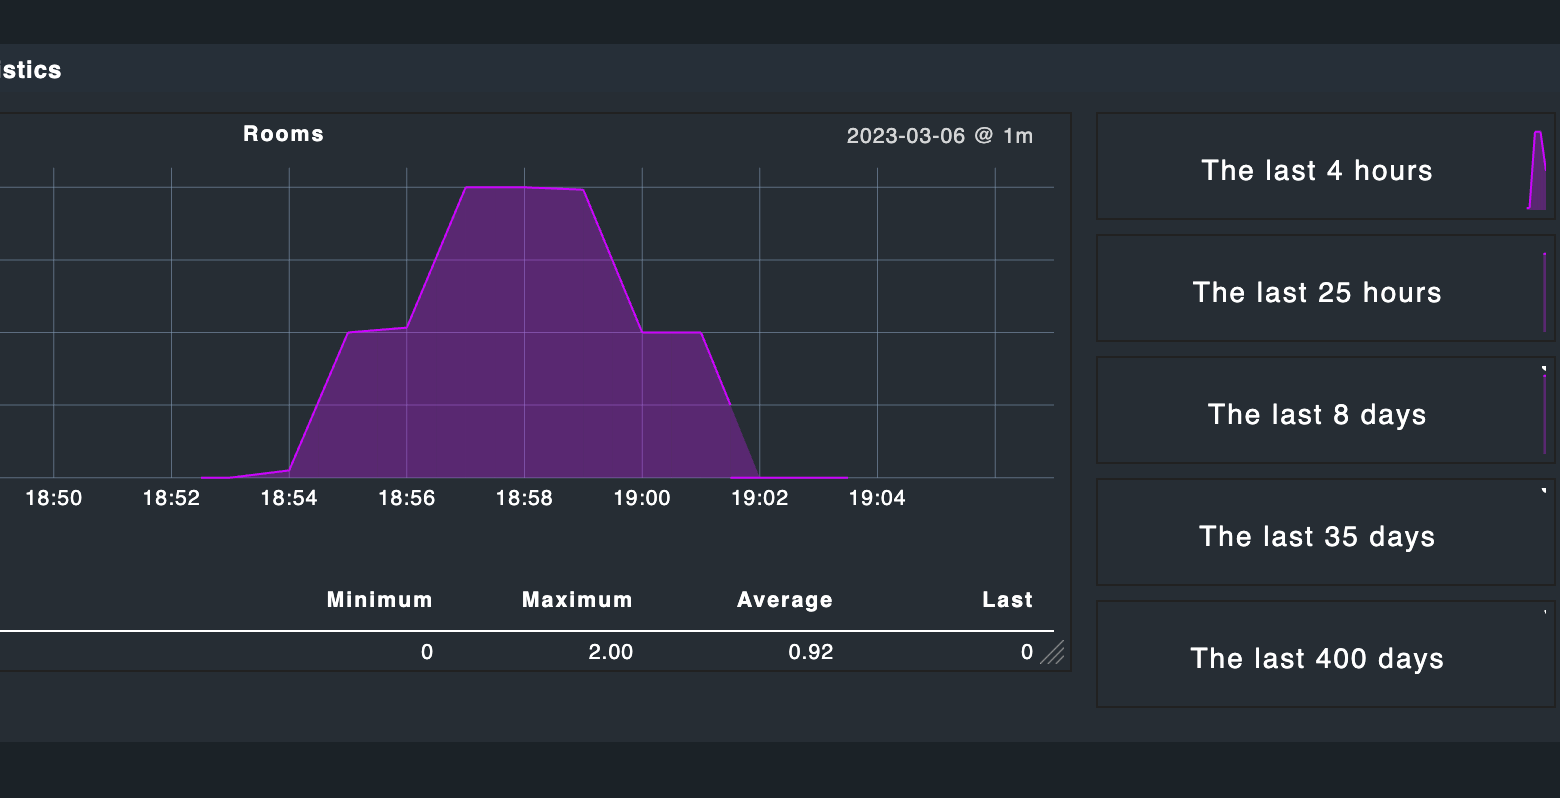
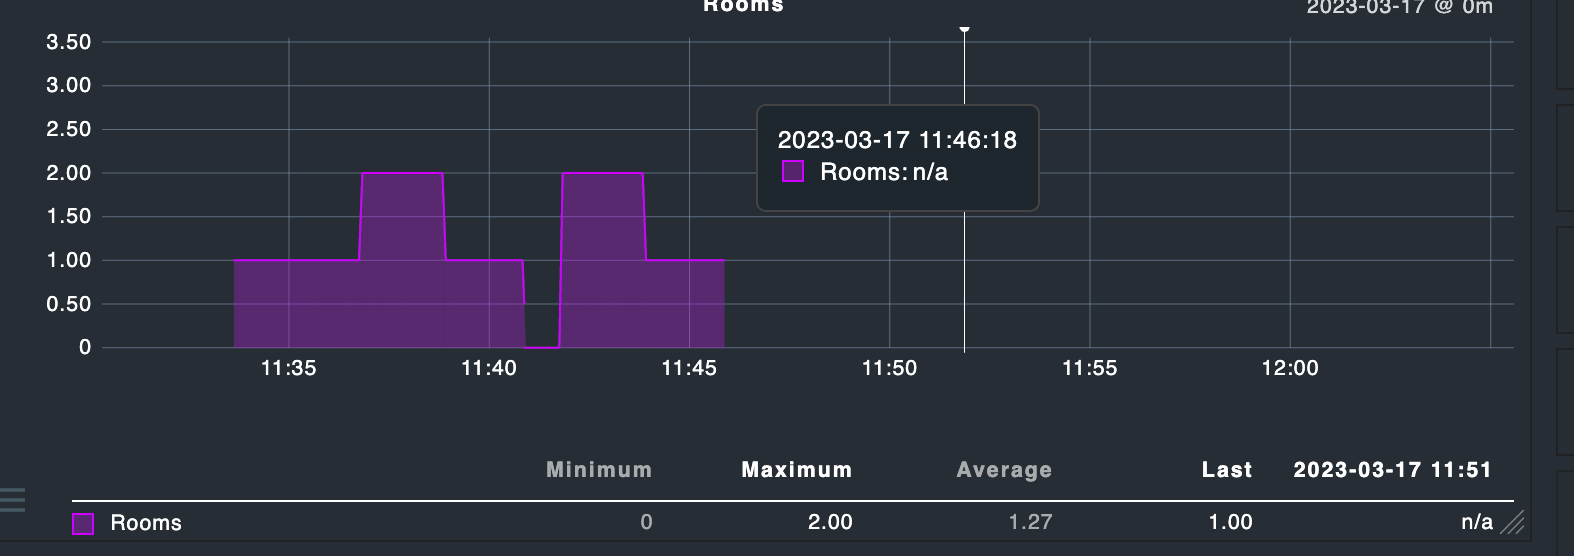
No, it is still not there where I would like to have that. I’m still not having my pure digital graph with sharp edges. This one describes the number of (conference) rooms seen active. Of course it went from 0 to 1 to 2 to 1 to 0 again. Values in the graph are: 0, 0.05, 1, 1.03, 2, 1.98, 1, 0 and so on.
Is that all what I can achieve?
OK, meanwhile I’m trying to accept that it is not possible to achieve with the means I have.
Thanks anyway ![]()
This topic was automatically closed 365 days after the last reply. New replies are no longer allowed. Contact an admin if you think this should be re-opened.