So I have tried now multiple times to create great dashboards to convert some monitoring that is done in Observium today to Checkmk but it’s really hard. Some things just don’t work, some does not work as I intended etc.
I want to create a dashboard that uses host labels and to create bookmarks using these where I create dashboards for core routers, firewalls, important switches etc.
I want to see:
Overall in/out bandwidth (Here I want to define filters based on description, for example wan would imply all WAN interfaces…
Routing engine CPU load aggregated
Top 10 Interfaces bandwidth
Top 10 interfaces with tx/rx errors
etc
Has anyone used observium in the past and converted something into Checkmk? I want to have ideas on how to do this
In short, “yes” (apart from top 10). By default you get common “like thing” aggregation easily (talking CEE version in particular).
We monitor a large switch stack, but just letting you know, queries to the devices can take minutes, just they way it is with switch stacks.
As for breaking things down, yes, but you have to do some of this yourself either by creating service groups and adding to them or simply by adding graphs you want to a custom graph. The former is a bit more dynamic, if your switching “style” is dynamic, but uniform… then the services (interfaces, etc) can be matched against.
Top 10? Well, I think this has been discussed elsewhere as a something we’d like to see.
Should be no problem with proper description on the interfaces.
If the check for this device exists then also possible.
For the top 10 things, why? In my bigger systems with over 20k network interfaces, no one want’s to know a top 10 interface. But you can do this also with some clever service searches and sorting then with the performance values.
For important interfaces we create bookmarks or dashboards and that’s it.
Interfaces with error are notified if they are important.
Only problem you can have is what @cjcox already said, the needed time to query bigger stacks.
Yes, I have now added the description (if any) to the service it selves to its easy to search fo it.
I think you misunderstood, i don’t want to see the top 10, we have more switches than you have ports so that would be even more useless in our case. However we use labels (that we import from our CMDB) so I can pick top 10 of all our core switches, our firewalls or even switches in one datacenter or room. That is useful for us.
Now Checkmk is not that intelligent so that I can use labels when creating graphs (for example) that would make this dynamic for us.
Yes we want to use bookmarks that shows a network view with pre-defined search filters (host labels in our case)
The problem now is that most things in a dashboard have to be static and that does not work for us (we move switches around, change hostnames of them etc etc every day)
All views and dashboards can also use labels as filters. There you have the option to filter the complete dashboard for one specific label or only single dashboard elements.
Do you encountered a special problem while filtering the dashboard?
Also for graphs the labels should work. Where was your problem there?
Graphs are only single-host today, so even if I can use labels for filters I will be stuck with an empty graph. That is UNLESS I use the graphs that is provided in the “Linux” and “Windows” dashboard.
do you follow my problem?
Search for the Service you want to have inside one graph. Here you can use the labels also.
Then you can select the menu option. “Services” → “All metrics of the same type in one graph”
There is at the moment a limit at 100 metrics in one graph i think.
@r.sander if there are more then 20k network devices monitored i was expecting that it is no raw edition
I think you maybe missed my earlier point
“The problem now is that most things in a dashboard have to be static and that does not work for us (we move switches around, change hostnames of them etc etc every day)”
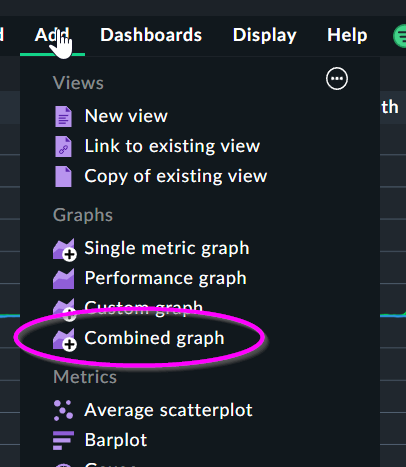
combined graphics are static, and are not using labels - EXPECT the ones that are included in the Windows and Linux dashboard.
You can test this yourself, just copy that dashboard, and keep the Interface plugins. Remove the cmk/ host label and replace it with your container and you will get dynamic networking graphs for all your containers
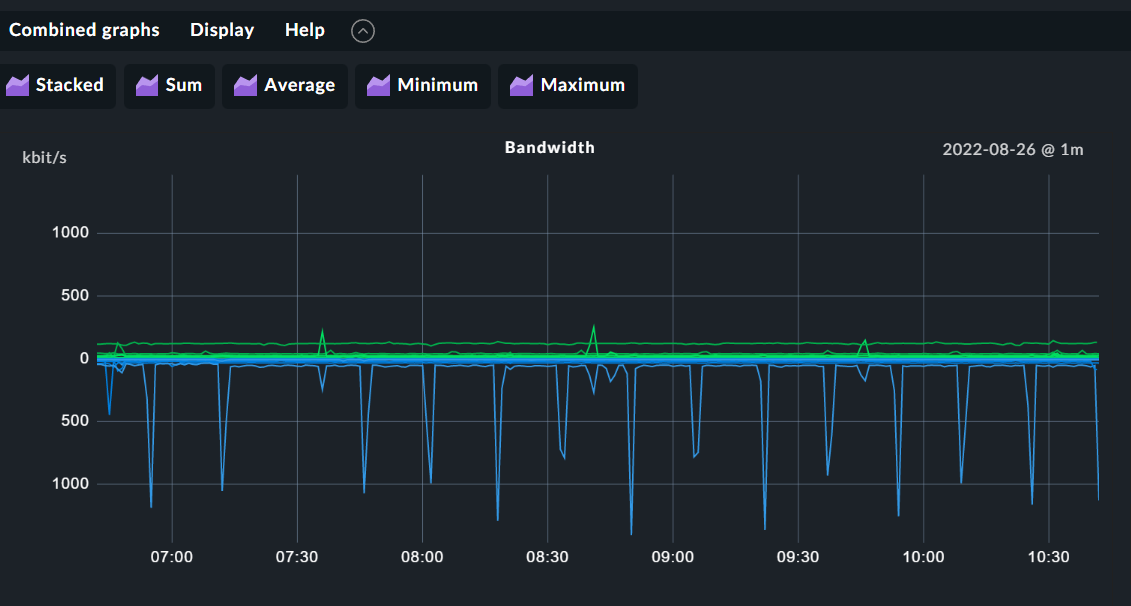
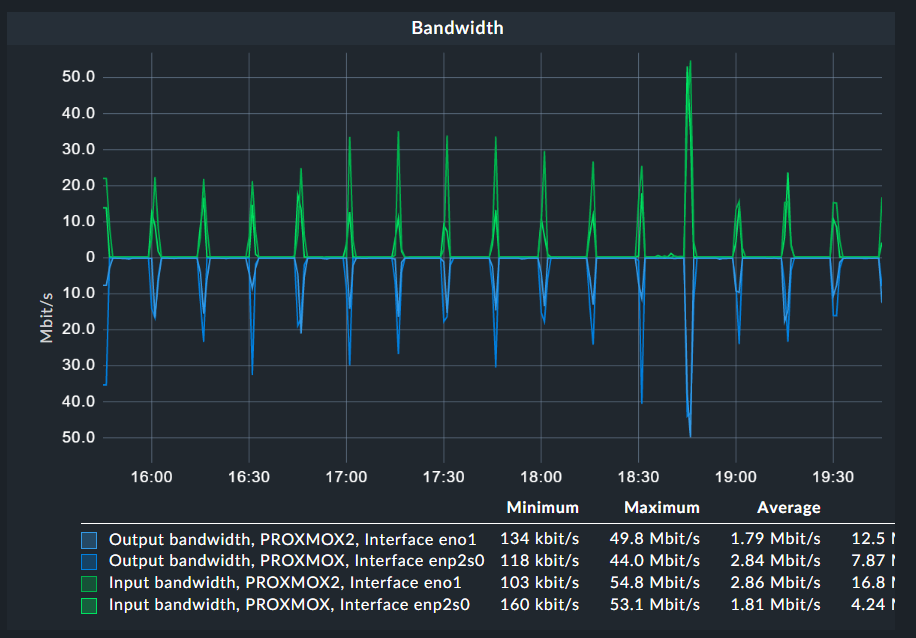
Here one example of combined graph in dashboard that is not static.
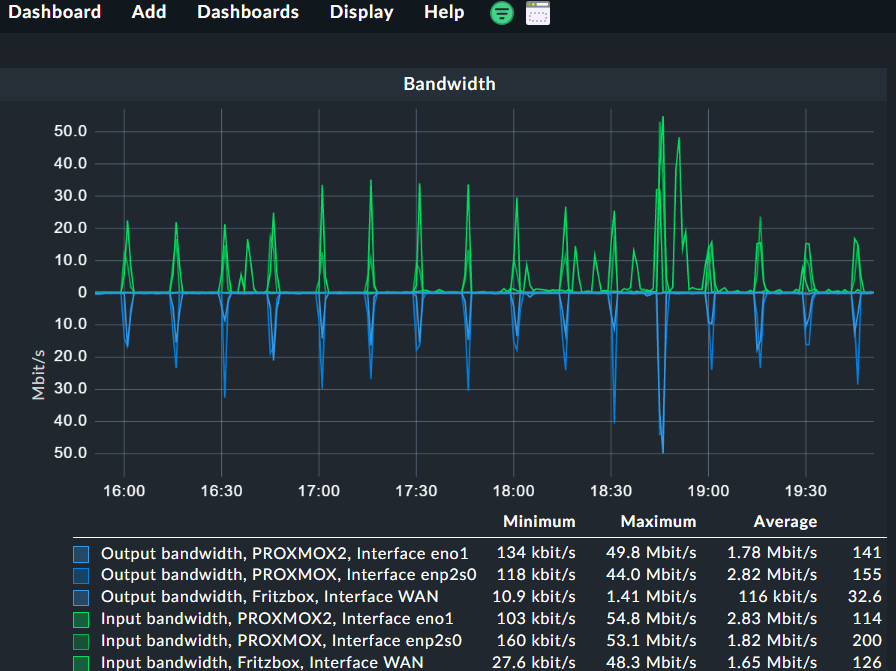
First graph shows the combined traffic of two hosts with the same host label and the second graph i assigned the same label to a third host and it shows automatically inside the graph.
If I add a host label in the Combined Graph I get just an empty graph.
I want to use the host label I set in the Dashboards so I can re-use the same dashboard.
That’s correct for specific cases. Let me strip down (I did not read all comments, but the last two – I’m very sorry, but I wanted to answer if I have two minutes) the use case:
A user wants to add a combined graph for a given predefined graph (e.g. Bandwidth)
The graph should not be limited by specific hosts but by a label
With these two requirements, we have two possible outcomes:
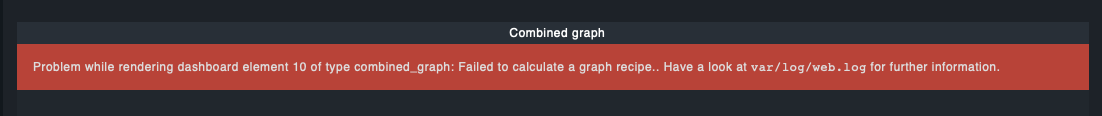
You will see the error, we can see in the screenshot of @Anders. This is, because different hosts are matching, that do not share the same graph type. Even, these graph types share the same title (“Bandwidth”)
You will see the combined graph as defined. This, because you took care, that only a group of hosts of the same type are matching.
Some more explanation:
We want to provide a consistent look on our graphs. But not all devices/operating systems provide the same level of detail or in the same type. This is, why we provide actually several graph definitions, that are a bit different, but look the same.
This may have the consequences, that you are not able to combine the CPU utilization of a Cisco devices with a Linux server into the same combined graph. But, it is possible for your group of Linux hosts.
Let me summarize: You may skip the hostname filter, but you need to take care, that only hosts of the same type are matching. E.g. by using the host label “cmk/os_family:linux”. Otherwise, you may encounter issue like the above.
This topic was automatically closed 365 days after the last reply. New replies are no longer allowed. Contact an admin if you think this should be re-opened.