Hi all. I am testing this product as a possible monitoring solution for the Kubernetes infra that we are building right now.
This is the setup. We are running Tanzu Kubernetes with F5 virtual server ingress. We used the official helm chart to retrieve the values.yaml and configured the following
service:
    # if required specify "NodePort" here to expose the cluster-collector via the "nodePort" specified below
    **type: ClusterIP**
    port: 8080
    targetPort: 30035
    annotations:
      **nodeportlocal.antrea.io/enabled: "true"**
i would upload some files but i am apperently not allowed to. but i got the publishing right because i can reacht the https://serversname/docs website and i can authorize with the token from the secrets that has been created during the deployment
We configured special agent as per documentation for the cluster controller but we receive this error
Status: Setup Error (Failure to establish a connection to cluster collector at URL [](https://checkmk-sf-tkc-0001.dev.***.com/metadata) )**CRIT** , Nodes with container collectors: 1/3, Nodes with machine collectors: 1/3
now, when i open this link i get a
{
    "detail": "Not authenticated"
}
when i use a rest client i get “ERROR - An unknown network error occured”
when i look at the pod events i get this
Events:
  Type     Reason     Age                    From     Message
  ----     ------     ----                   ----     -------
  Warning  Unhealthy  30m (x150 over 20h)    kubelet  (combined from similar events): Liveness probe failed: Get "http://100.64.2.37:10050/health": context deadline exceeded (Client.Timeout exceeded while awaiting headers)
  Warning  Unhealthy  25m (x2048 over 22h)   kubelet  Readiness probe failed: Get "http://100.64.2.37:10050/health": context deadline exceeded (Client.Timeout exceeded while awaiting headers)
  Warning  Unhealthy  10m (x1757 over 22h)   kubelet  Liveness probe failed: Get "http://100.64.2.37:10050/health": context deadline exceeded (Client.Timeout exceeded while awaiting headers)
  Normal   Pulled     5m28s (x226 over 23h)  kubelet  Container image "checkmk/kubernetes-collector:1.5.1" already present on machine
  Warning  BackOff    35s (x1697 over 22h)   kubelet  Back-off restarting failed container cluster-collector in pod checkmk-controller-cluster-collector-79cb646447-ghh8q_checkmk-monitoring-dev(0024e15b-4ab7-4f36-9eda-16da9f073eb4)
so the pod consistently failing but i dont know why.
looking at this part of the events output i wonder why it is trying to do the health check on port 10050. i did not configure this port anywhere. and we have a deny-all rule set by default. is there some intra-pod communication going on for this to work?
thanks for the feedback. I took the deny-all out for testing and will focus on that later. The collector was deployed and i do get feedback but now i am stuck with the daemonset.app which does not create the pods due to this error
Warning FailedCreate 13m daemonset-controller Error creating: pods "checkmk-controller-node-collector-container-metrics-22mm9" is forbidden: violates PodSecurity "baseline:latest": non-default capabilities (container "cadvisor" must not include "SYS_PTRACE" in securityContext.capabilities.add), hostPath volumes (volumes "var-run", "sys", "docker")
When i created the namespace i added the baseline policy
Thank you. i adapted the namespace with the label and the controller is now green
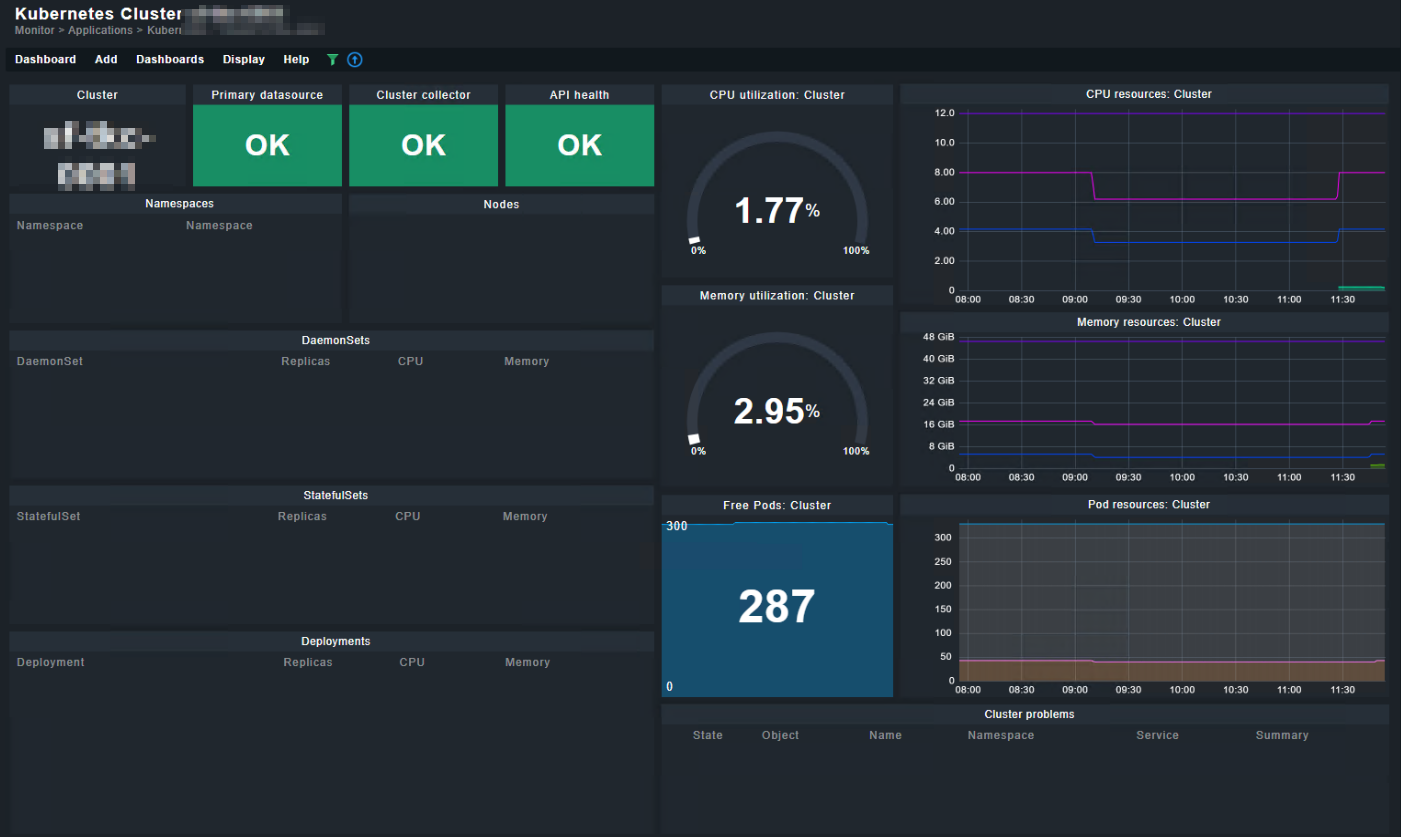
I assume the information boxes below may take some time until populated with data?
from the container metrics pods i found these and i wonder if thats an issue
 kubectl logs -n checkmk-monitoring-dev pods/checkmk-controller-node-collector-container-metrics-8qrs5
Defaulted container "cadvisor" out of: cadvisor, container-metrics-collector
W0311 12:55:20.633547       1 machine_libipmctl.go:64] There are no NVM devices!
W0311 12:55:20.638098       1 info.go:53] Couldn't collect info from any of the files in "/etc/machine-id,/var/lib/dbus/machine-id"
W0311 12:55:20.644902       1 manager.go:286] Could not configure a source for OOM detection, disabling OOM events: open /dev/kmsg: no such file or directory
W0311 13:00:21.478293       1 machine_libipmctl.go:64] There are no NVM devices!
W0311 13:00:21.568070       1 info.go:53] Couldn't collect info from any of the files in "/etc/machine-id,/var/lib/dbus/machine-id"
W0311 13:05:21.477813       1 machine_libipmctl.go:64] There are no NVM devices!
W0311 13:05:21.481852       1 info.go:53] Couldn't collect info from any of the files in "/etc/machine-id,/var/lib/dbus/machine-id"
W0311 13:10:21.478221       1 machine_libipmctl.go:64] There are no NVM devices!
W0311 13:10:21.482494       1 info.go:53] Couldn't collect info from any of the files in "/etc/machine-id,/var/lib/dbus/machine-id"
W0311 13:15:21.478315       1 machine_libipmctl.go:64] There are no NVM devices!
W0311 13:15:21.482965       1 info.go:53] Couldn't collect info from any of the files in "/etc/machine-id,/var/lib/dbus/machine-id"
W0311 13:20:21.477528       1 machine_libipmctl.go:64] There are no NVM devices!
W0311 13:20:21.481982       1 info.go:53] Couldn't collect info from any of the files in "/etc/machine-id,/var/lib/dbus/machine-id"
W0311 13:25:21.478091       1 machine_libipmctl.go:64] There are no NVM devices!
W0311 13:25:21.483224       1 info.go:53] Couldn't collect info from any of the files in "/etc/machine-id,/var/lib/dbus/machine-id"
W0311 13:30:21.478604       1 machine_libipmctl.go:64] There are no NVM devices!
W0311 13:30:21.565532       1 info.go:53] Couldn't collect info from any of the files in "/etc/machine-id,/var/lib/dbus/machine-id"
W0311 13:35:21.477841       1 machine_libipmctl.go:64] There are no NVM devices!
W0311 13:35:21.482476       1 info.go:53] Couldn't collect info from any of the files in "/etc/machine-id,/var/lib/dbus/machine-id"
W0311 13:40:21.477665       1 machine_libipmctl.go:64] There are no NVM devices!
W0311 13:40:21.488067       1 info.go:53] Couldn't collect info from any of the files in "/etc/machine-id,/var/lib/dbus/machine-id"
W0311 13:45:21.477553       1 machine_libipmctl.go:64] There are no NVM devices!
W0311 13:45:21.484129       1 info.go:53] Couldn't collect info from any of the files in "/etc/machine-id,/var/lib/dbus/machine-id"
W0311 13:50:21.477485       1 machine_libipmctl.go:64] There are no NVM devices!
W0311 13:50:21.482184       1 info.go:53] Couldn't collect info from any of the files in "/etc/machine-id,/var/lib/dbus/machine-id"
Is it possible that your automation user was changed or is not administrator anymore?
Or is this instance only a “slave” instance inside a distributed monitoring?
This topic was automatically closed 365 days after the last reply. New replies are no longer allowed. Contact an admin if you think this should be re-opened.