Hello all,
we have a virtual server with 8-core and 32gn RAM where we have setup more then 1000 services to monitor, related to 300 routers/switches that in future they will grow up.
Actually agents don’t read the graphs related to the band and we need to fix it because we can’t have period of time without the band graphs.
For the vanished service problem you only need to refresh the service discovery.
As the name is the same as before it should have no impact on the other things.
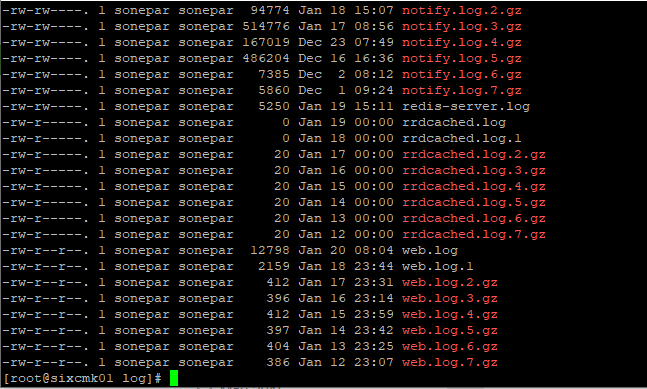
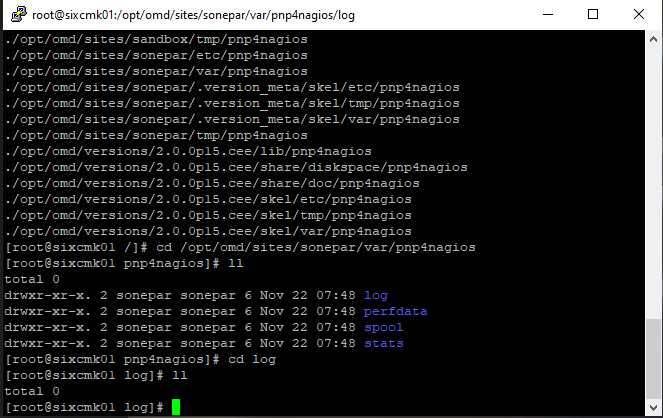
For your graph problem you should inspect the rrdcached and pnp4nagios log files if there is a problem to write the performance data to disk.
It is strange that the same check (e.g. “Interface 1”) appears both in Undecided services and Vanished services. Normally, this should not happen. Is there a minor spelling difference, like different number of blanks between “Interface” and “1”?
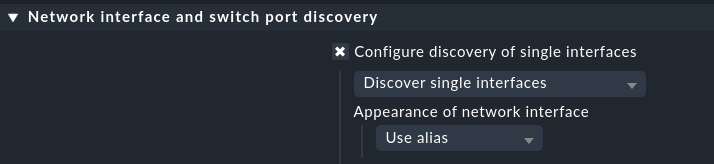
Do you have a rule of type “Network interface and switch port discovery” for that host? If none, I would consider adding a rule, and select “Use alias” or “Use description” for the discovery (see screenshot).
Then it is an enterprise edition what was not mentioned in the first posts.
If you have problems with your rrd files and use the enterprise edition then you need to look at the “cmc.log” inside “~/var/log”.
This topic was automatically closed 365 days after the last reply. New replies are no longer allowed. Contact an admin if you think this should be re-opened.