We have some nagios checks which output TB with bytes, so the output would be something like this:
NETAPP AGGREGATE CRITICAL - 5 aggregates checked, 1 CRITICAL, 2 WARNING
s01-02.data02: 91.3%, 320.6TiB used (CRITICAL)
s01-03.data03: 81.3%, 143.3TiB used (WARNING)
s01-04.data04: 84.0%, 148.1TiB used (WARNING)
s01-01.ssd01: 29.7%, 8.871TiB used
s01-03.temp_data01: 75.5%, 331.6TiB used
| 's01-03.data03_rel'=81.273%;80;90;0; 's01-03.data03_abs'=157579579105280;155111728939008;174500695056384;0; 's01-01.ssd01_rel'=29.703%;80;90;0; 's01-01.ssd01_abs'=9753440178176;26268830207180;29552433983078;0; 's01-04.data04_rel'=83.993%;80;90;0; 's01-04.data04_abs'=162853936676864;155111728939008;174500695056384;0; 's01-02.data02_rel'=91.286%;80;90;0; 's01-02.data02_abs'=352479524982784;308899743606374;347512211557171;0; 's01-03.temp_data01_rel'=75.484%;80;90;0; 's01-03.temp_data01_abs'=364583926775808;386395150106624;434694543869952;0;
This is then interpreted by check_mk correctly under the service details like this:
s01-02.data02: 91.3%, 320.6TiB used (CRITICAL)
s01-03.data03: 81.3%, 143.3TiB used (WARNING)
s01-04.data04: 84.0%, 148.1TiB used (WARNING)
s01-01.ssd01: 29.7%, 8.873TiB used
s01-03.temp_data01: 75.5%, 331.7TiB used
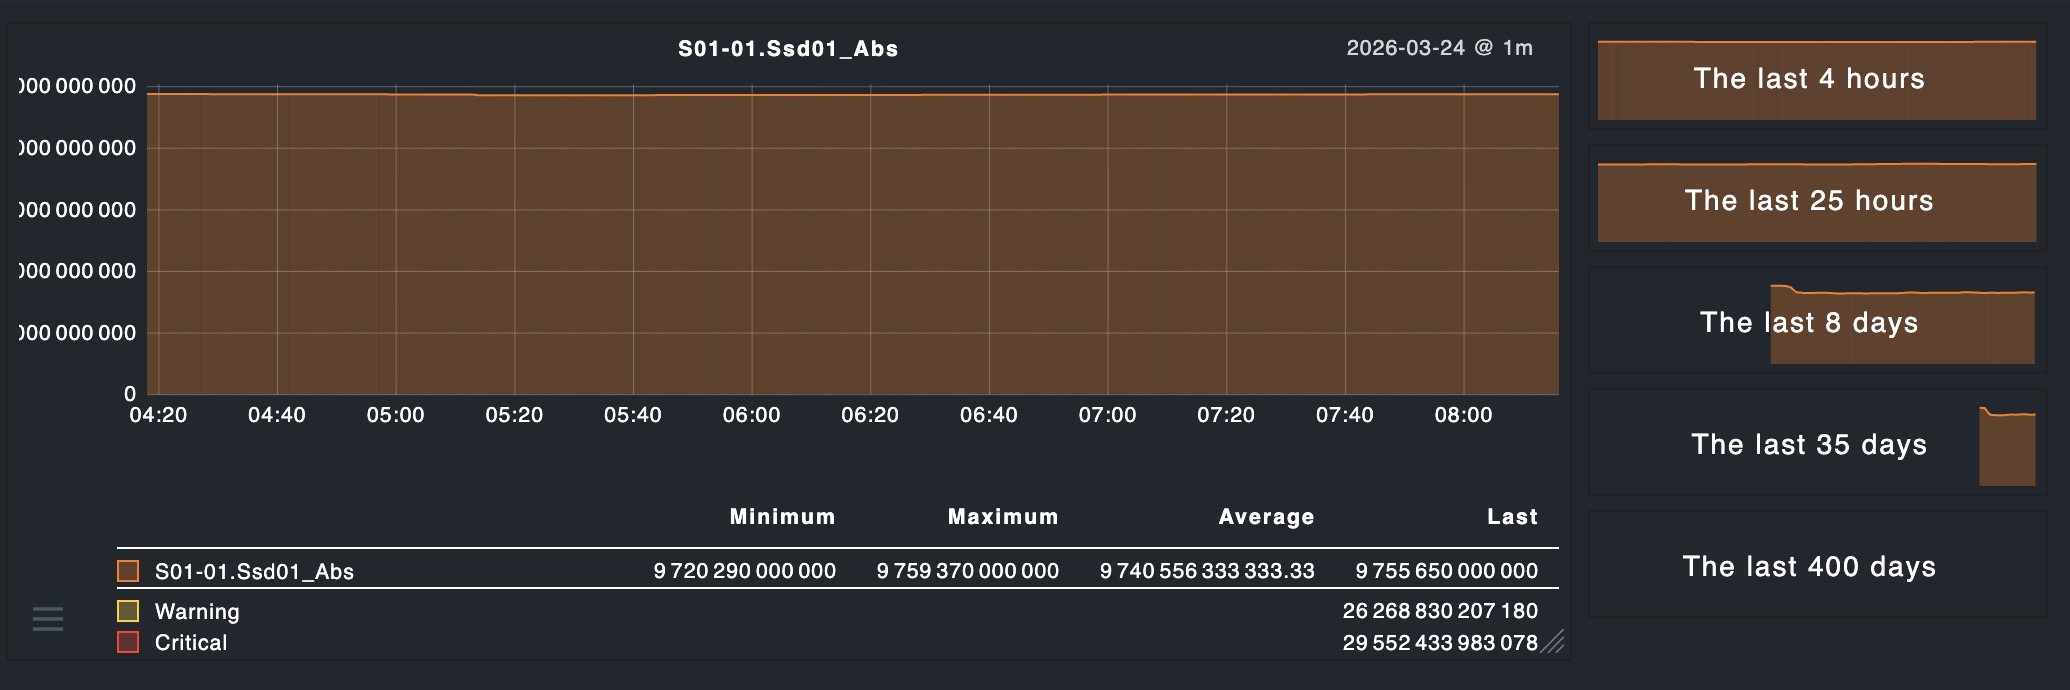
Yet the graps are using the number 157579579105280 and does not realize that this is TB.. so the graps are pretty much useless… as shown below… (not the same data, but shows the problem with the cutoff and use of bytes…)
This issue comes from the fact that Checkmk knows nothing about these metric names.
It is just a number and Checkmk does not know that the unit is Bytes and can be made more human readable with prefixes like Tera.
You would have to create metric definitions and tell Checkmk what unit these metrics have.
The issue here is that the metric name is derived from the aggregate name on the NetApp filer and is therefor dynamic. This is not a good idea as you cannot easily write metric definitions for each possible aggregate on your NetApp filers.
BTW: why don’t you use the builtin NetApp special agent and its check?
Hi, yeah sadly we cannot add any units to this… and as you mention it would be an issue if the check did this, because if you have small units, should it then be GB rather than TB etc.. and you don’t want to change this as you grow or shrink… to me it would make sense that check_mk had some kind of way to tell it that, this is bytes, please make it humanreadable…
The netapp checks we use can do so much more than check_mk’s verison, and we would rather use one set of tools… we have never had any issues with our current checks, so we would very much like to use them instead of check_mks… but as I am slowly learning, it’s a right pain to use nagios checks in check_mk, and it involves many, many sets of rules etc… so I am not even sure it’s worth the switch from omd/thruk. I like check_mk’s views and alerting features, yet it seems so cumbersome if you have to wave out site the standards setup, so I fear that we will need to spend way more time managing this as we do right now… but I am still learning of cause maybe it’s just me (I hope it is)
Just to clearify… if we added “B” after each value, would check_mk’s graphs be able to make it human readable? Or do we need to do the math for check_mk and choose a value like GB and present it like 11223344GB ?
OK, so you are telling me there is no easy way to “fix” this…You basically have to either sort it out in the check script and stick to GB/TB or whatever?
Or… you try to setup the metrics definitions whre the “name=” has to match 100% and no wildcards or REGEX can be used to make it a bit easier?
It’s quite unfortunate that Checkmk deliberately ignores the UOM field.
Imagine if the MRPE and local checks could simply pass common UOMs such as 'number=10;', 'time=10s;', 'size=10B;', 'percentage=10%;', or 'count=10c;', and Checkmk would automatically recognize the unit type and display it correctly in the graphs. This approach would also work with dynamically generated metric names.
Even better would be the ability to define custom UOMs through configuration - similar to how metrics.Metric(...) handles them. Such flexibility would make metric handling far more intuitive and open up new possibilities for creating custom checks and richer, more meaningful visualizations.
To be honest, we shouldn’t have to tell them such a simple obvious idea… which is already implemented and has been for some time in the Thruk/OMD packages…