Hi @The-Judge,
Great bug report — the pattern you describe (works in discovery, works with simulated walk, fails intermittently on large devices) points to two separate root causes that are likely both at play.
Root cause 1: SNMP cache corruption Discovery uses a fresh fetch; the regular check uses cached data. There is a known Checkmk caching bug (Werk #13226) that causes exactly this symptom. Clear it first:
bash
rm -rf ~/var/check_mk/snmp_cache/HOSTNAME
cmk -vvn HOSTNAME
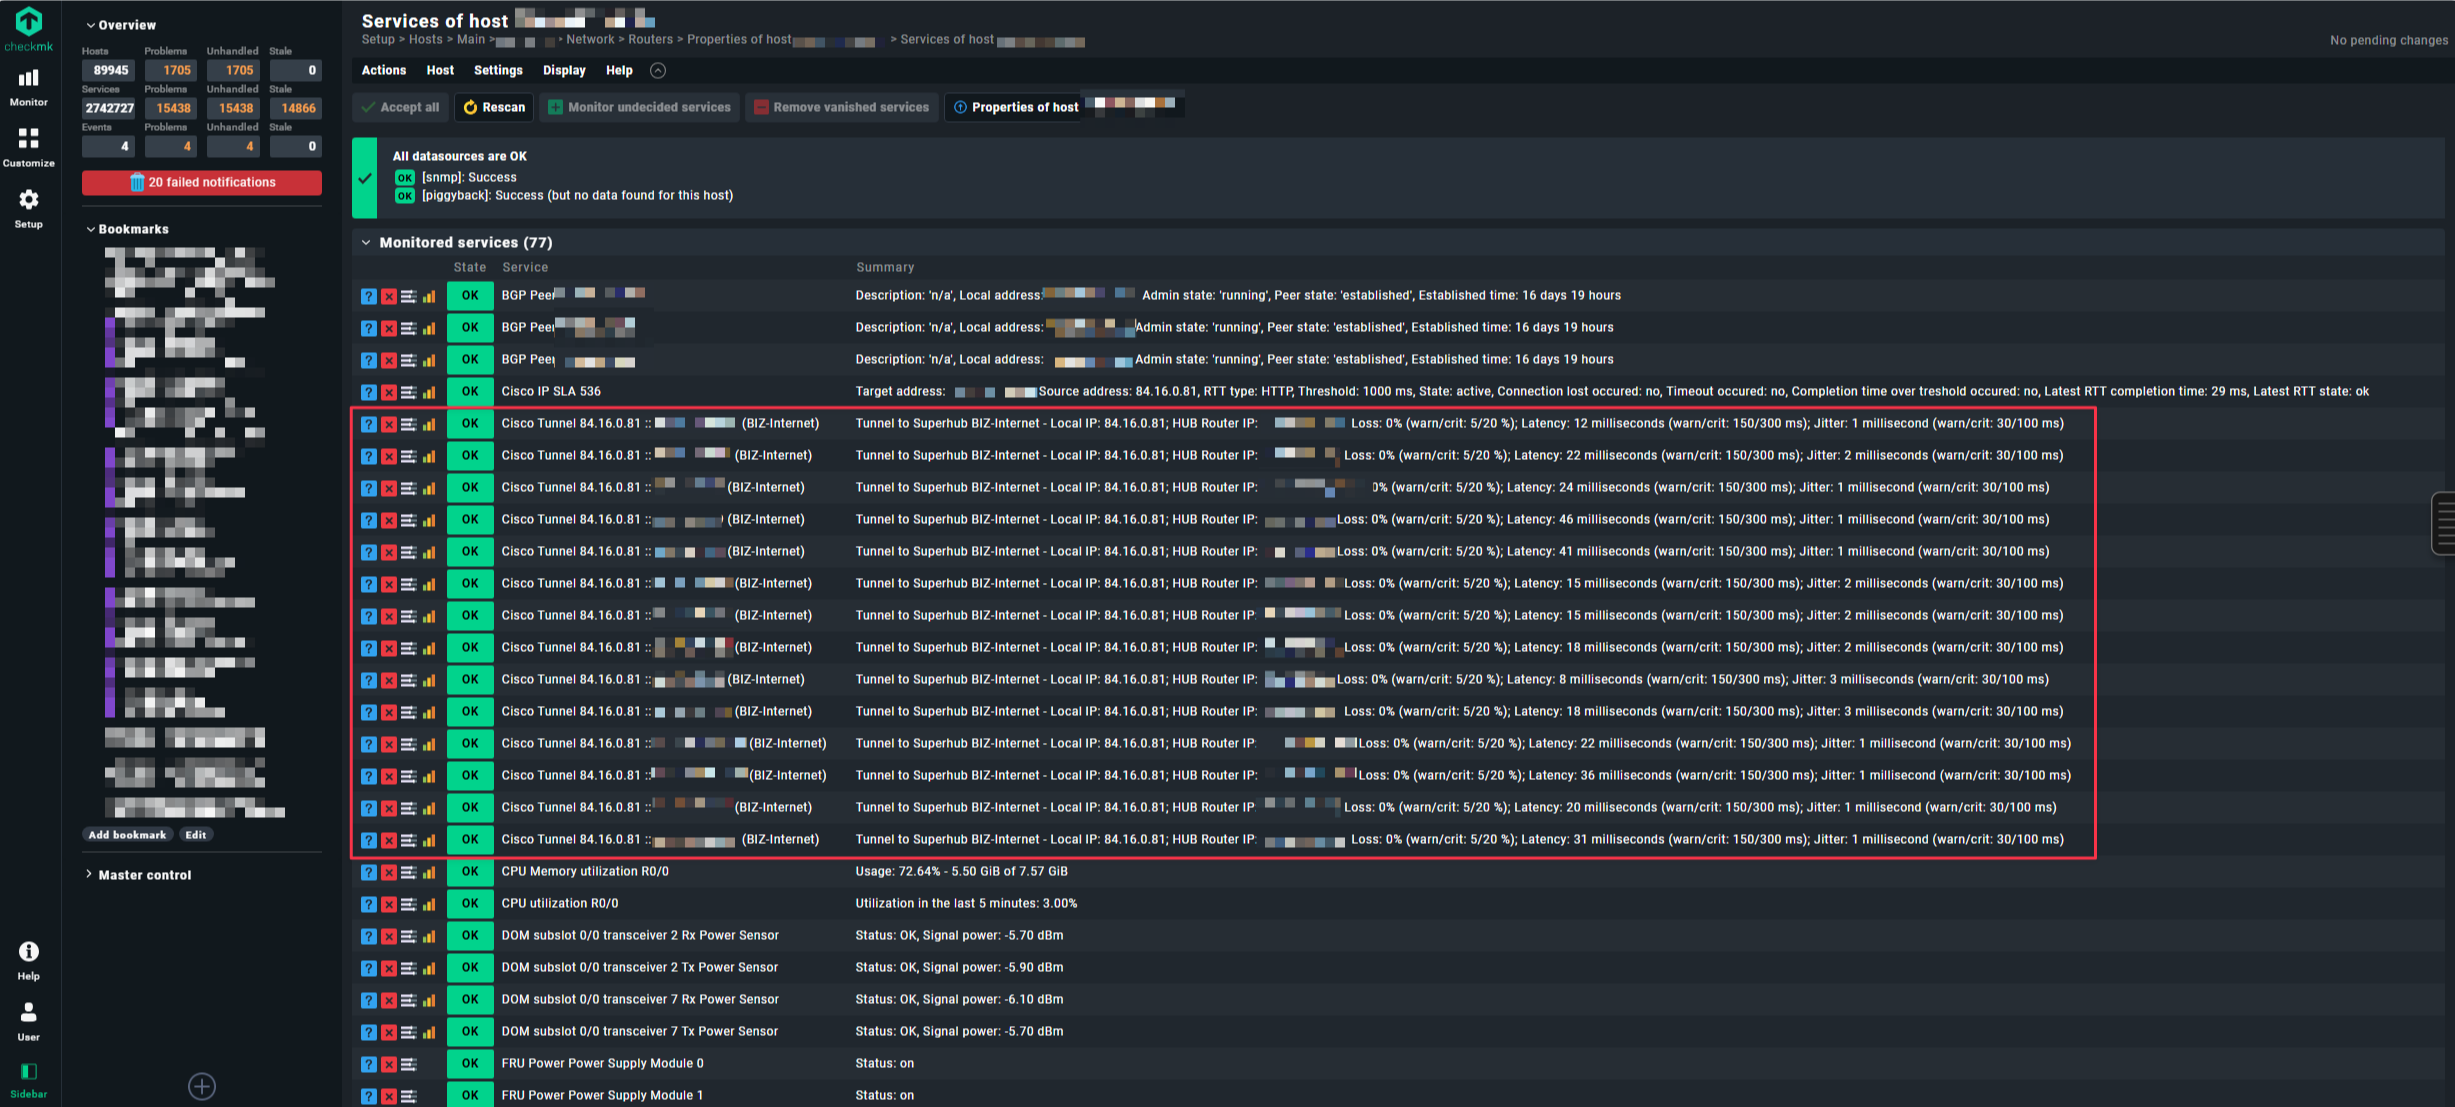
If the service comes back OK once after this, the cache was stale.
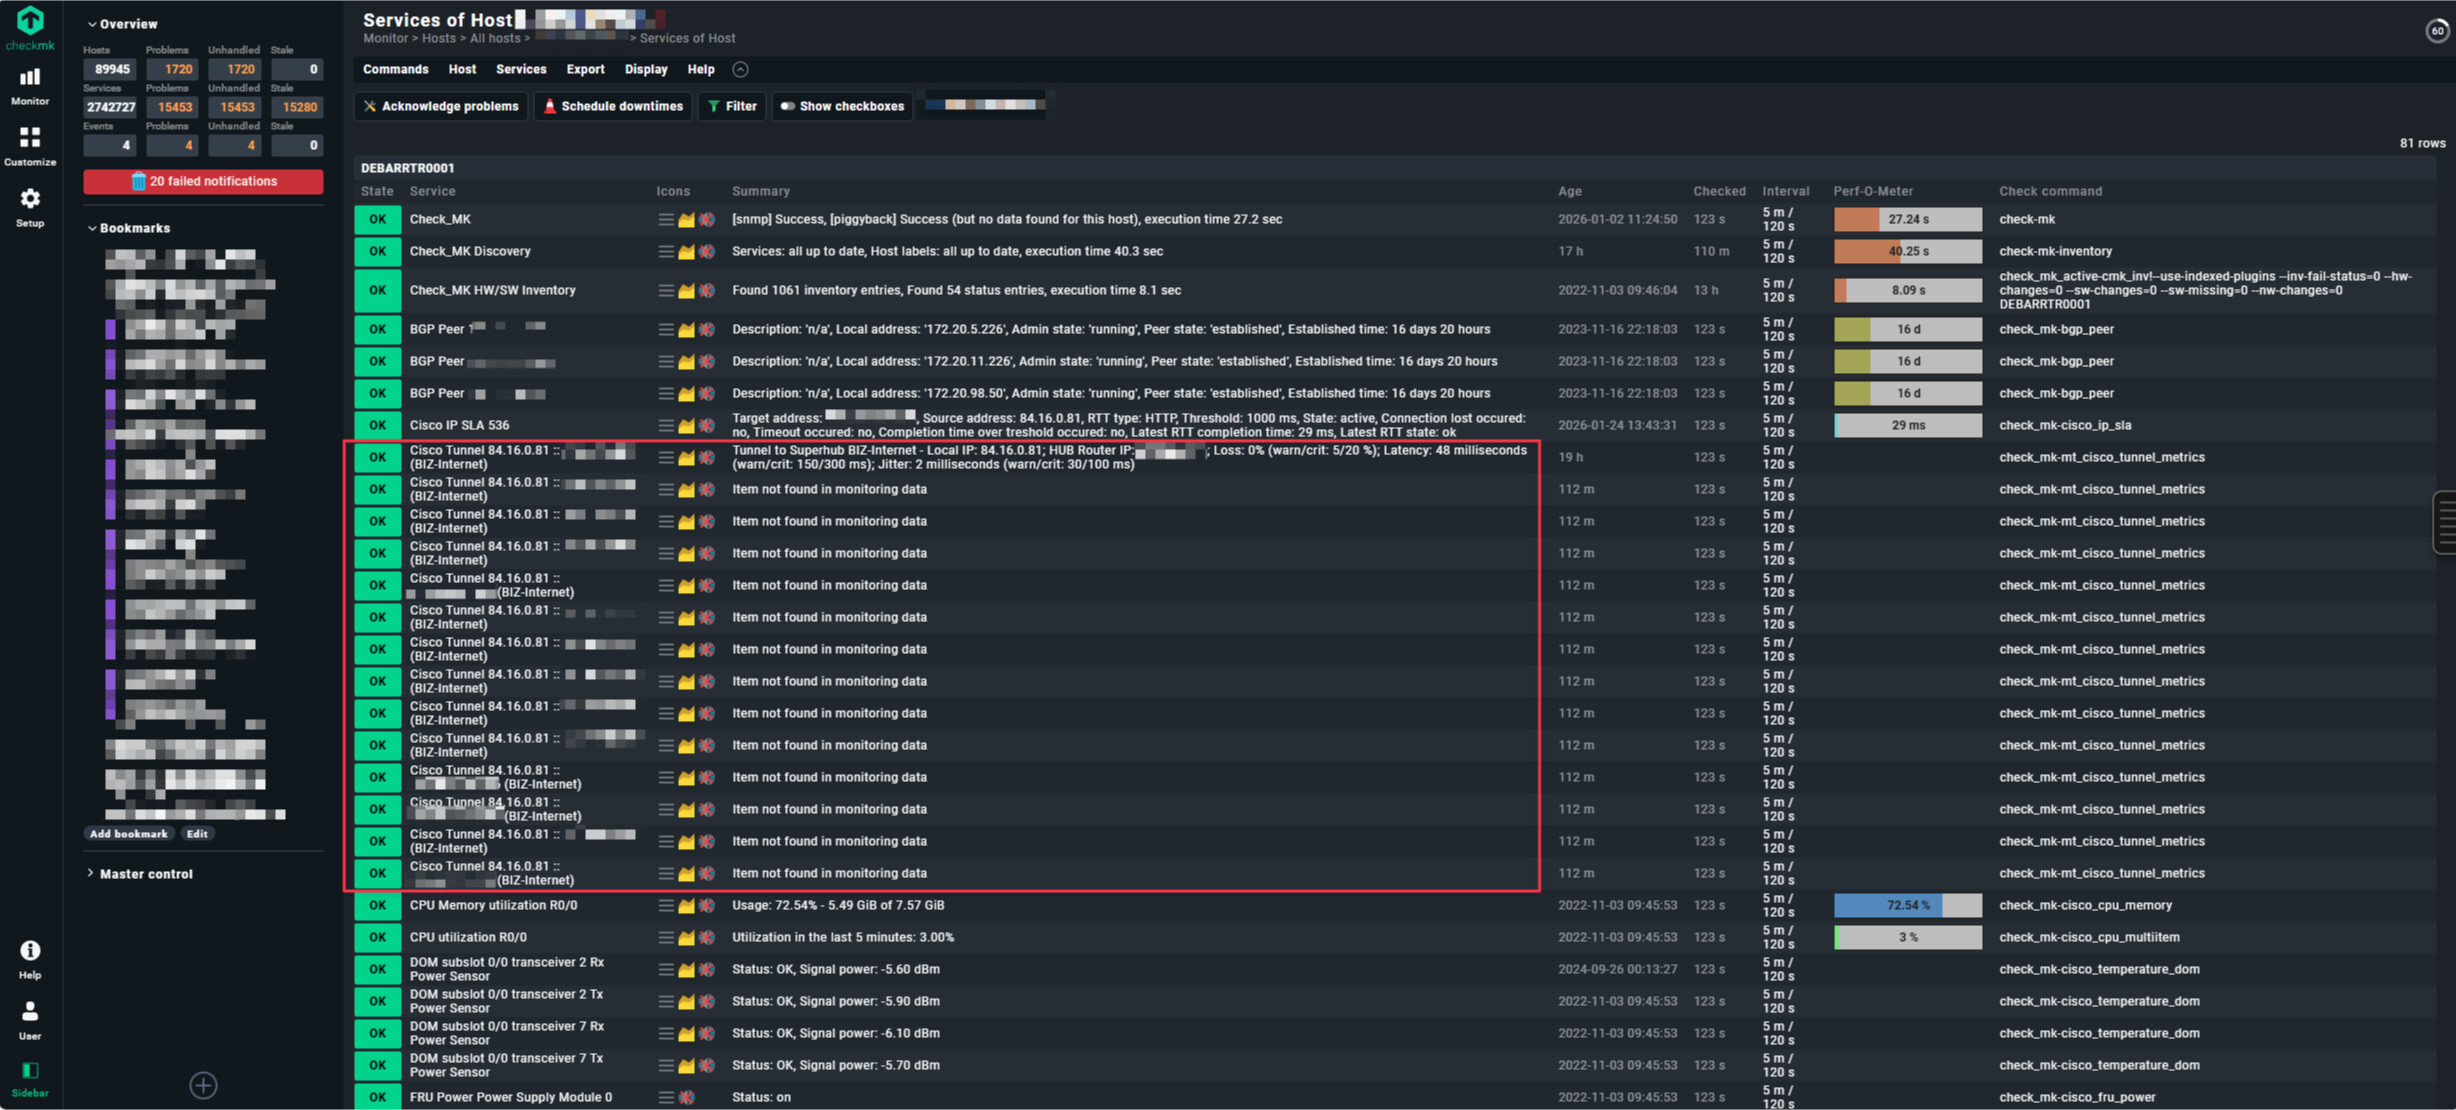
Root cause 2: Two SNMPTree fetch with OIDEnd() — index mismatch risk Your fetch has two separate SNMPTree entries, both using OIDEnd() as the item identifier. If the Cisco device returns different tunnel indices in .1.3.6.1.4.1.9.9.1001.1.2.1.7 vs .1.3.6.1.4.1.9.9.1001.1.5 (e.g. a tunnel exists in the type table but has no metrics entry yet), the discovery creates a service for tunnel ID X, but the check_function cannot find ID X in the metrics table → “Item not found”.
Verify with:
bash
snmpwalk -v2c -c COMMUNITY HOST .1.3.6.1.4.1.9.9.1001.1.2.1.7 | awk -F'OID: ' '{print $2}' | sort > t1.txt
snmpwalk -v2c -c COMMUNITY HOST .1.3.6.1.4.1.9.9.1001.1.5 | awk -F'OID: ' '{print $2}' | sort > t2.txt
diff t1.txt t2.txt
Root cause 3: Timeout on large devices 53 MB walks mean the two sequential SNMP fetches together likely exceed the Check_MK service timeout (default 60s), causing the second tree to arrive incomplete. Fix via Setup → Timing settings for SNMP access — increase total timeout to 120s and reduce bulk size from 10 to 5.
The simulated walk always works because it reads from a local file with no timeout.
Diagnostic:
Step 1 — clear Cache and check directly :
bash
rm -rf ~/var/check_mk/snmp_cache/HOSTNAME
cmk -vvn HOSTNAME 2>&1 | grep -A5 "cisco_ipsla\|your_plugin_name"
Step 2 — Fetch-Timing:
bash
time cmk --snmpwalk --oid .1.3.6.1.4.1.9.9.1001.1.2.1.7 \
         --oid .1.3.6.1.4.1.9.9.1001.1.5 HOSTNAME
if it`s take >60s Timeout will be the cause
Step 3 — What is really in the 2 Trees?
bash
cmk -vvn HOSTNAME 2>&1 | grep -E "Fetching|section|snmp_cache"
Step 4 — OIDEnd()-entry compare:
bash
# Tree 1: Tunnel-Typ
snmpwalk -v2c -c COMMUNITY HOSTNAME .1.3.6.1.4.1.9.9.1001.1.2.1.7 | \
  awk -F'.' '{print $NF}' | cut -d' ' -f1 | sort > /tmp/tree1_ids.txt

# Tree 2: Tunnel-metric
snmpwalk -v2c -c COMMUNITY HOSTNAME .1.3.6.1.4.1.9.9.1001.1.5 | \
  awk -F'.' '{print $NF}' | cut -d' ' -f1 | sort > /tmp/tree2_ids.txt

# Difference: Was in Tree 1 but not in Tree 2?
diff /tmp/tree1_ids.txt /tmp/tree2_ids.txt
If differences appear here, the plugin logic is the problem. If there are no differences, it’s timing/cache.
Solutions
Solution A — Timeout encrease (if there is a Timing-Problem):
Setup → Hosts & Service Parameters → Access to Agents →
"Timing settings for SNMP access"
→ Total timeout: 120s (statt 60s default)
→ Bulk size: 10→5 (smaller Packets, more solide by big Walks)
Solution B — Optimize SNMP v2c Bulk Walk
Solution C — Robust parse function (if OIDEnd mismatch):
def parse_cisco_ipsla(string_table):
    tunnel_types, tunnel_metrics = string_table

    # Build index map from tree 1
    type_map = {row[0]: row[1] for row in tunnel_types if row}

    # Build index map from tree 2
    metrics_map = {row[0]: row[1] for row in tunnel_metrics if row}

    parsed = {}
    # ONLY include tunnels with data in BOTH trees
    for tunnel_id in type_map:
        if tunnel_id in metrics_map:
            parsed[tunnel_id] = {
                "type": type_map[tunnel_id],
                "metrics": metrics_map[tunnel_id],
            }
        # Tunnels that only exist in tree 1 → ignore instead of "item not found"

    return parsed
happy monday … 
Bernd