Kube cluster agent thread creation issue

CMK version: 2.1.0
OS version: RKE k8s 1.21.12
CMK Kubernetes Agent version: 1.0.0 (last version available on Helm)

I have noticed an issue since installation of Kubernetes Agent on my cluster.
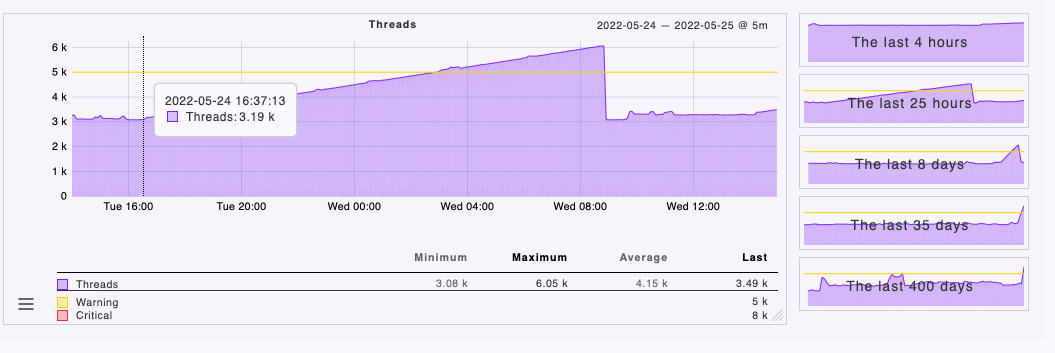
The agent seems creating a lot of threads. Please see screenshot for one of my worker node :

  • Helm installation 1 : Tuesday 16:00

  • Helm uninstallation 1 : Wednesday 09:00

  • Helm installation 2 : Wednesday 14:00 (you can see the climbing beginning).

The kube-agent-node-collector-machine-sections seems the culpit :

#docker stats 4174e120f78b --no-stream

CONTAINER ID   NAME                                                                                                                                                CPU %     MEM USAGE / LIMIT   MEM %     NET I/O   BLOCK I/O     PIDS
4174e120f78b   k8s_machine-sections-collector_checkmk-kube-agent-node-collector-machine-sections-5dnx7_checkmk-kube-agent_cdb934ee-b935-4c20-8821-599549afc15e_0   0.00%     23.27MiB / 200MiB   11.63%    0B / 0B   8.63MB / 0B   205
#ps afx
 3571 ?        Sl     0:00 /usr/bin/containerd-shim-runc-v2 -namespace moby -id 4174e120f78b08ec956e6bffbf383f54ffe374492c23d5fa32197819e1c71dab -address /run/containerd/containerd.sock
 3683 ?        Ss     0:01  \_ /usr/local/bin/python /usr/local/bin/checkmk-machine-sections-collector --log-level=debug
 4012 ?        Zs     0:00      \_ [timeout] <defunct>
 4015 ?        Zs     0:00      \_ [timeout] <defunct>
 4018 ?        Zs     0:00      \_ [timeout] <defunct>
 8575 ?        Zs     0:00      \_ [timeout] <defunct>
 8578 ?        Zs     0:00      \_ [timeout] <defunct>
 8582 ?        Zs     0:00      \_ [timeout] <defunct>
14662 ?        Zs     0:00      \_ [timeout] <defunct>
14665 ?        Zs     0:00      \_ [timeout] <defunct>
14668 ?        Zs     0:00      \_ [timeout] <defunct>
20353 ?        Zs     0:00      \_ [timeout] <defunct>
20356 ?        Zs     0:00      \_ [timeout] <defunct>
20360 ?        Zs     0:00      \_ [timeout] <defunct>
25178 ?        Zs     0:00      \_ [timeout] <defunct>
25181 ?        Zs     0:00      \_ [timeout] <defunct>
25184 ?        Zs     0:00      \_ [timeout] <defunct>
30485 ?        Zs     0:00      \_ [timeout] <defunct>
30493 ?        Zs     0:00      \_ [timeout] <defunct>
30496 ?        Zs     0:00      \_ [timeout] <defunct>
 3139 ?        Zs     0:00      \_ [timeout] <defunct>
....

The issue is the same on all nodes.

Thanks for your support.

Did you follow the steps as listed here: Episode 26: Monitoring Kubernetes with Checkmk - YouTube ?

I followed Monitoring Kubernetes from official docs.

Everything is working expected. The agent is connected and reporting metrics as expected.

The only problem I have is thread consumption :frowning:

Is it possible to know the timestamp of these processes ? What happens when you kill these Zombie processes ?

I found something interesting in commit log :

Each minute, 3 new defunct process :

root@dos1:~# date && docker stats 4174e120f78b --no-stream
mercredi 25 mai 2022, 14:10:55 (UTC+0000)
CONTAINER ID   NAME                                                                                                                                                CPU %     MEM USAGE / LIMIT   MEM %     NET I/O   BLOCK I/O     PIDS
4174e120f78b   k8s_machine-sections-collector_checkmk-kube-agent-node-collector-machine-sections-5dnx7_checkmk-kube-agent_cdb934ee-b935-4c20-8821-599549afc15e_0   0.00%     24.51MiB / 200MiB   12.25%    0B / 0B   8.63MB / 0B   337
root@dos1:~# date && docker stats 4174e120f78b --no-stream
mercredi 25 mai 2022, 14:11:02 (UTC+0000)
CONTAINER ID   NAME                                                                                                                                                CPU %     MEM USAGE / LIMIT   MEM %     NET I/O   BLOCK I/O     PIDS
4174e120f78b   k8s_machine-sections-collector_checkmk-kube-agent-node-collector-machine-sections-5dnx7_checkmk-kube-agent_cdb934ee-b935-4c20-8821-599549afc15e_0   1.95%     24.91MiB / 200MiB   12.46%    0B / 0B   8.63MB / 0B   340
root@dos1:~# date && docker stats 4174e120f78b --no-stream
mercredi 25 mai 2022, 14:12:11 (UTC+0000)
CONTAINER ID   NAME                                                                                                                                                CPU %     MEM USAGE / LIMIT   MEM %     NET I/O   BLOCK I/O     PIDS
4174e120f78b   k8s_machine-sections-collector_checkmk-kube-agent-node-collector-machine-sections-5dnx7_checkmk-kube-agent_cdb934ee-b935-4c20-8821-599549afc15e_0   0.00%     24.61MiB / 200MiB   12.30%    0B / 0B   8.63MB / 0B   343

Thanks for your inputs. We are aware of the problem and working on it. It should be fixed shortly by our development team.

1 Like

The problem with the Zombie processes should be fixed now. Please install the latest version from the helm repo. For example:

helm repo update
helm upgrade --install --create-namespace -n checkmk-monitoring checkmk tribe29/checkmk

Thanks for your support, I can confirm, thread issue is gone with chart 1.0.1 !

This topic was automatically closed 365 days after the last reply. New replies are no longer allowed. Contact an admin if you think this should be re-opened.