CMK version:
We have tried it with the following versions:
2.1.p09
2.1.p14
2.1.p18
OS version:
Debian 11 5.10.136-1
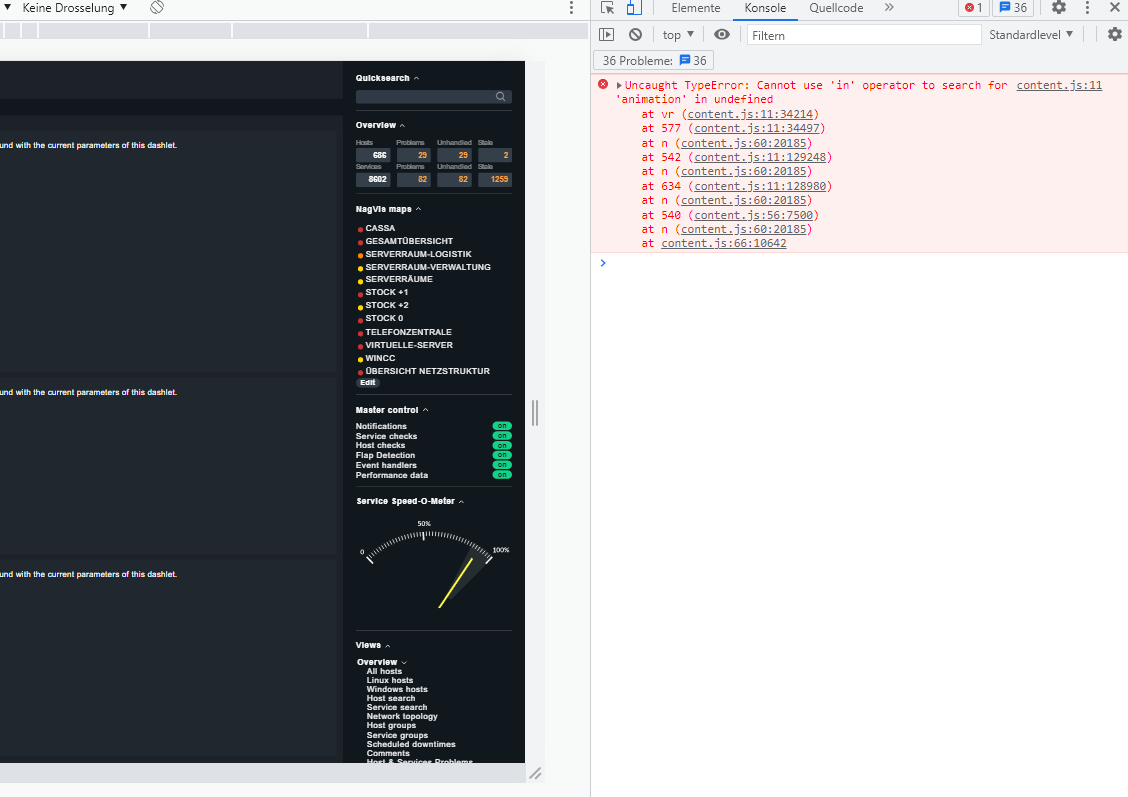
Error message (Browser Console):
Uncaught TypeError: Cannot use ‘in’ operator to search for ‘animation’ in undefined
Desc:
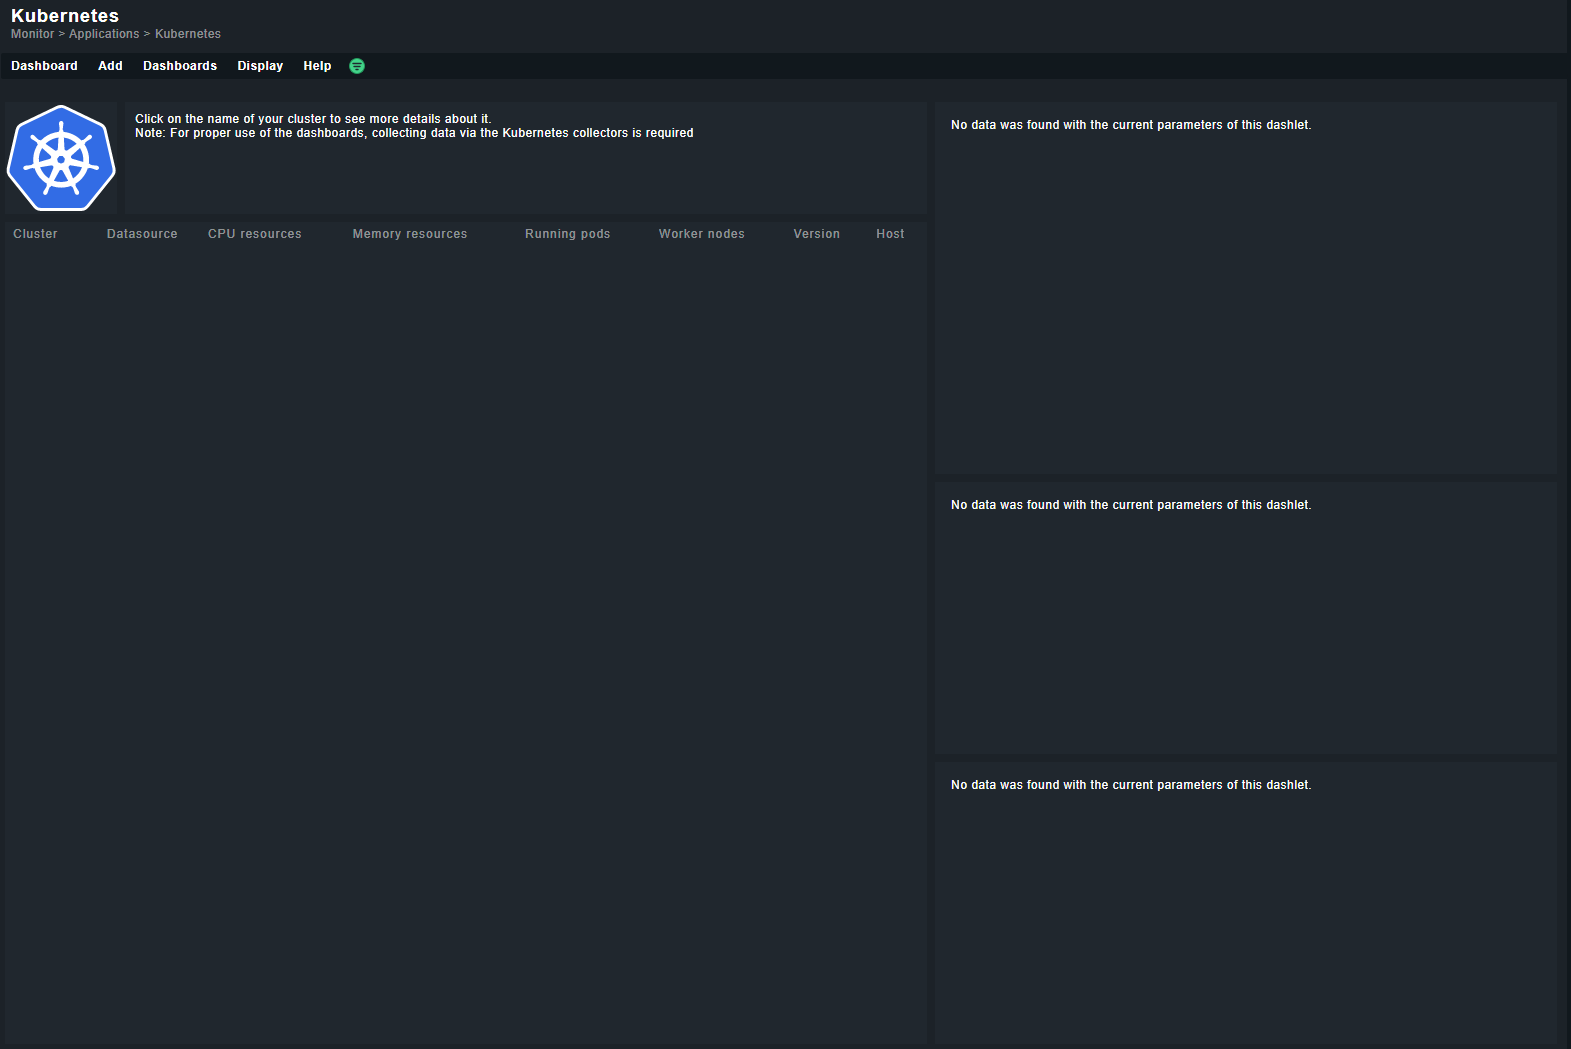
We followed the installation 1:1 as described in the documentation. We also receive all information correctly from the cluster (as in the documentation). All dynamic hosts are also created as they should be.
Can someone tell me with which version it works safely? Is this a version problem or have we probably done something wrong here?
The dashboards need host labels to be built. My assumption would be that these ones are missing. Hard to judge from here as the Check_MK Discovery Service is missing.
But I love that you used my initials for the cluster name
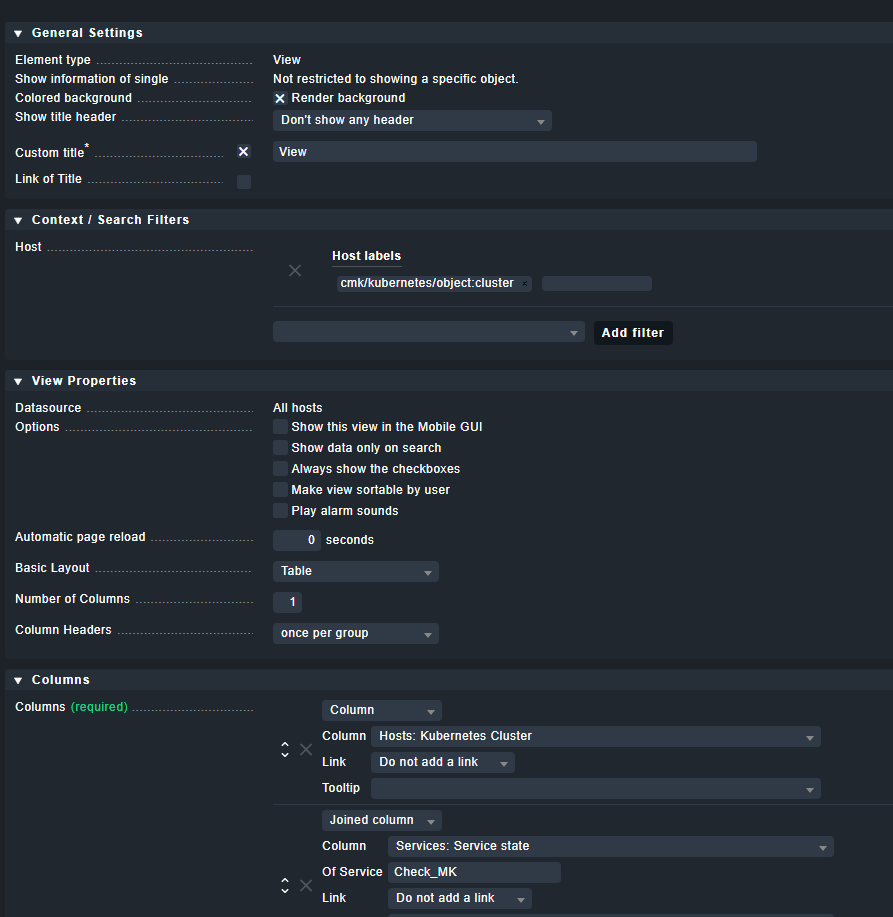
When I edit one of the elements, I get the following stored labels. Is that wrong? We haven’t changed anything on the dashboard itself yet? Do I have to? Because there is nothing about it in the documentation. (This is the default dashboard of Kubernetes).
And haha yes but that stands for something else xD
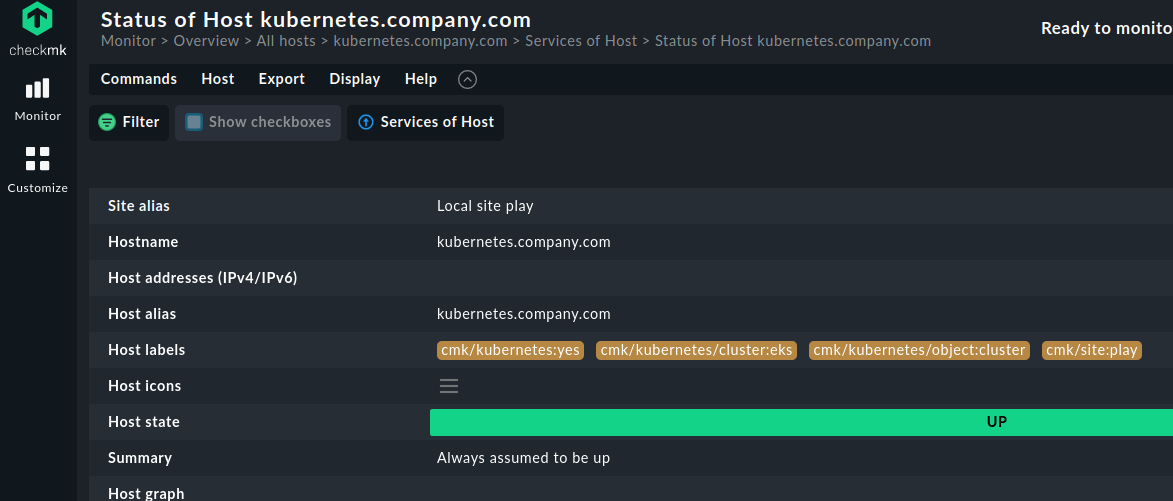
You don’t have to change anything in the dashboards. But in the screenshot, you can see the actual labels it needs (…object:cluster).
It seems your Kubernetes hosts don’t have any labels.
I had actually deposited some host labels, but for some reason “cmk/kubernetes/object:cluster” was missing.
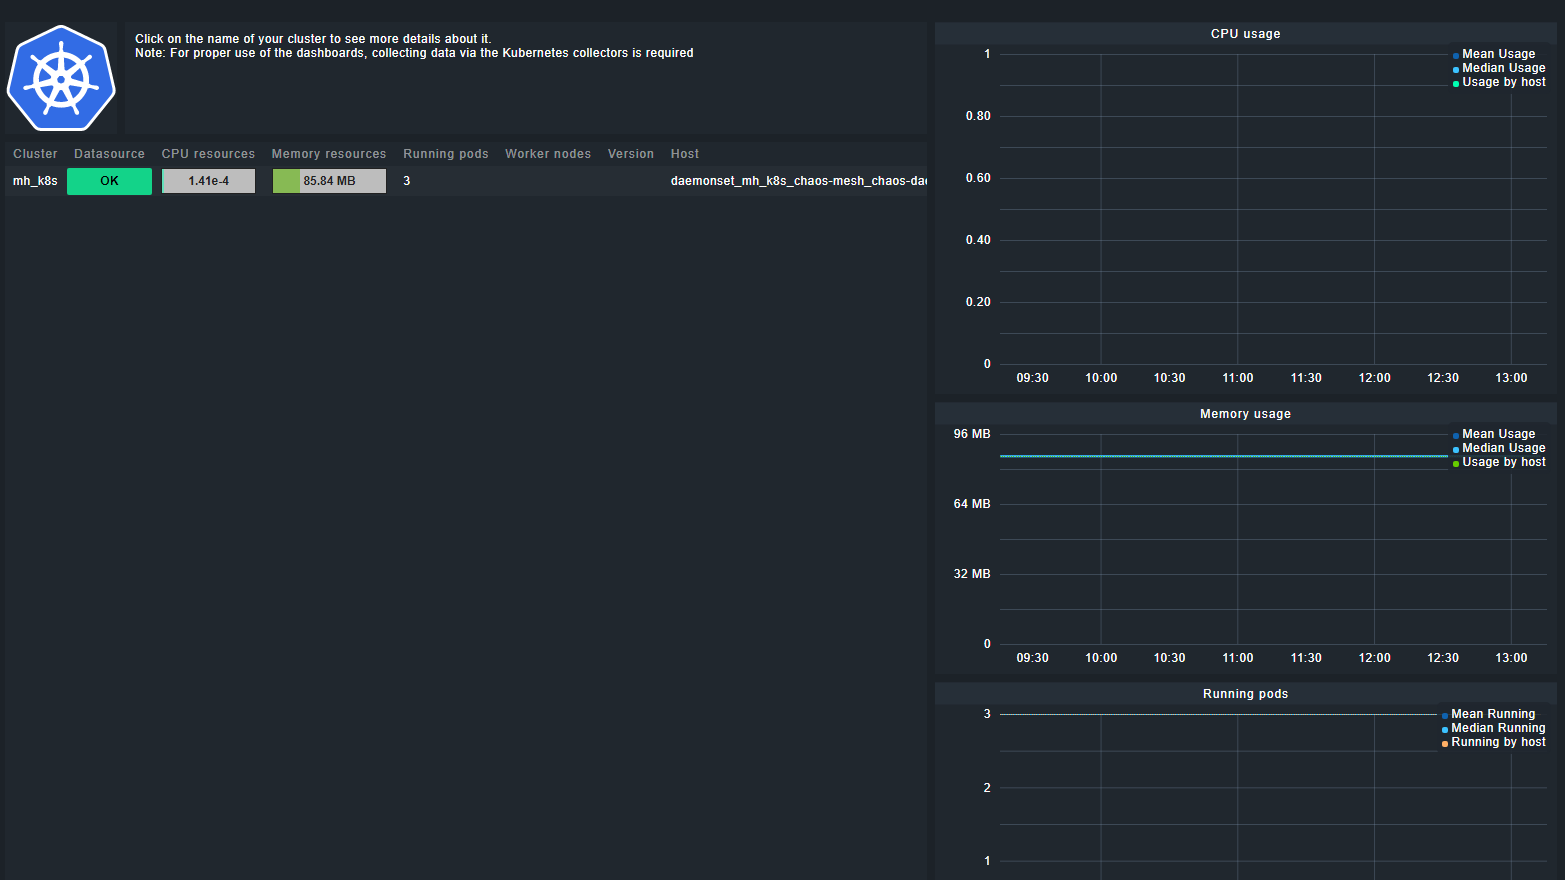
Now that I have manually added it in the hostconfig, I see the cluster, but when I navigate into it, some graphs do not load. Have we done something wrong here that the labels were not already correct at the beginning?
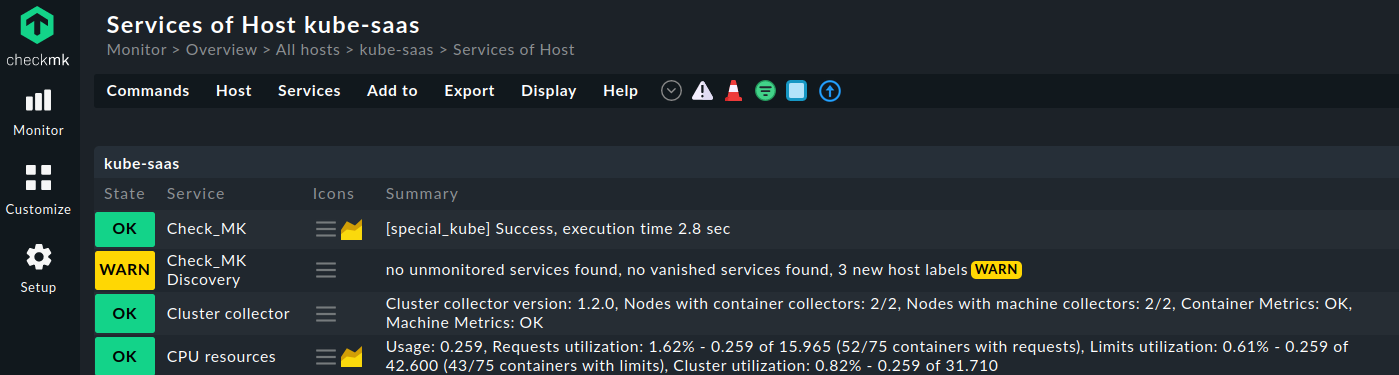
What troubles me most is your missing Check_MK Discovery Service. It is there by default, so I assume you must have removed it? (not wise!)
Because my assumption is, that you never discovered the host labels. The labels are automatically generated for Kubernetes. Don’t manually add them in the hostconfig.
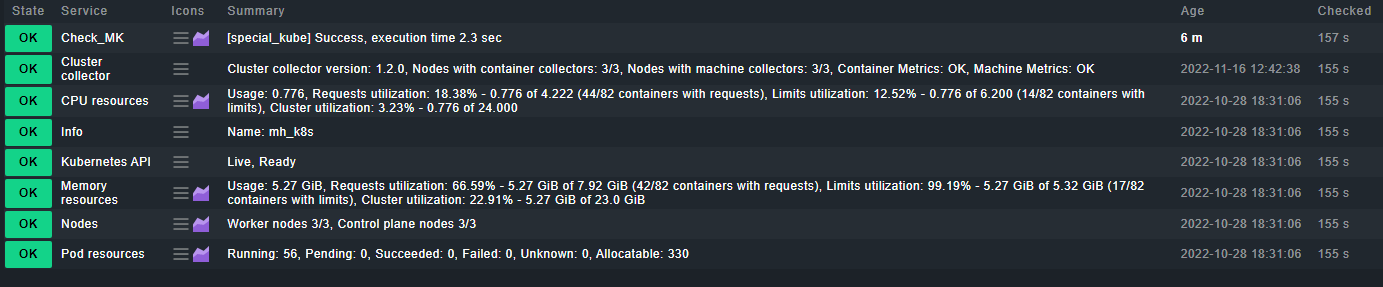
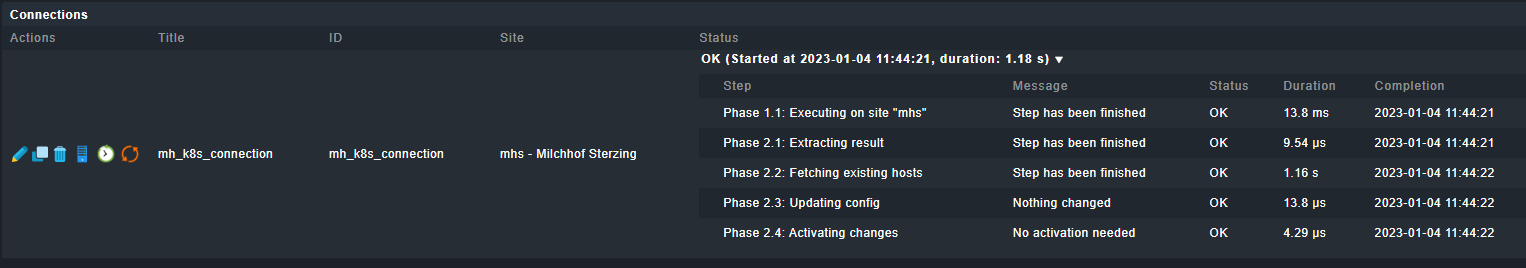
If you would have the Check_MK Discovery Service for you it probably would have looked like this:
→ 3 new host labels. If you click in the service discovery then “Accept all”, then all auto-generated host labels are being added.
The metrics are not being shown as you manually set the object:cluster label etc. on the wrong host (daemonset_mh_k8s_chaos-mesh_chaos…)
Thus, don’t manually set it.
Okay, I see, I didn’t notice that it was disabled, one of my colleagues disabled it and I didn’t know that. It works now that we have enabled it again. There are still a few small things, but I can solve them myself. Thank you very much!
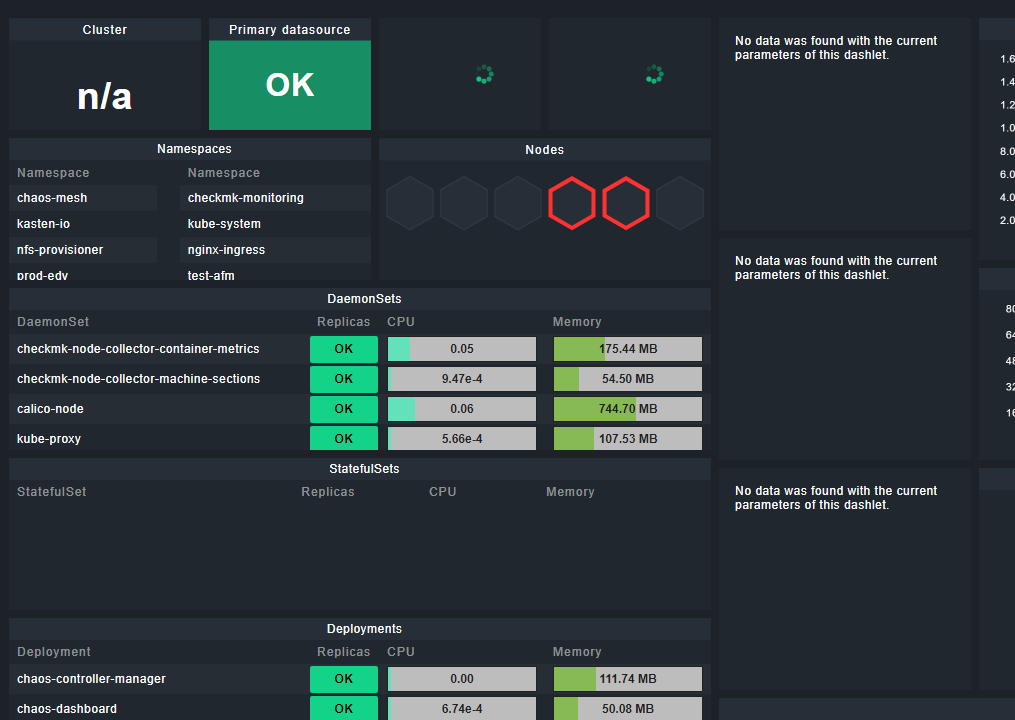
I have a similar issue on 2.1.0p25 Free Edition but I can only see the full dashboard on an iPhone (?) and not on any desktop devices. Attached to this message a screenshot of the cluster view from Chrome.
This topic was automatically closed 365 days after the last reply. New replies are no longer allowed. Contact an admin if you think this should be re-opened.