CMK version:
Checkmk Enterprise Edition 2.1.0p21 OS version:
Linux Cluster Error message:
No error message…
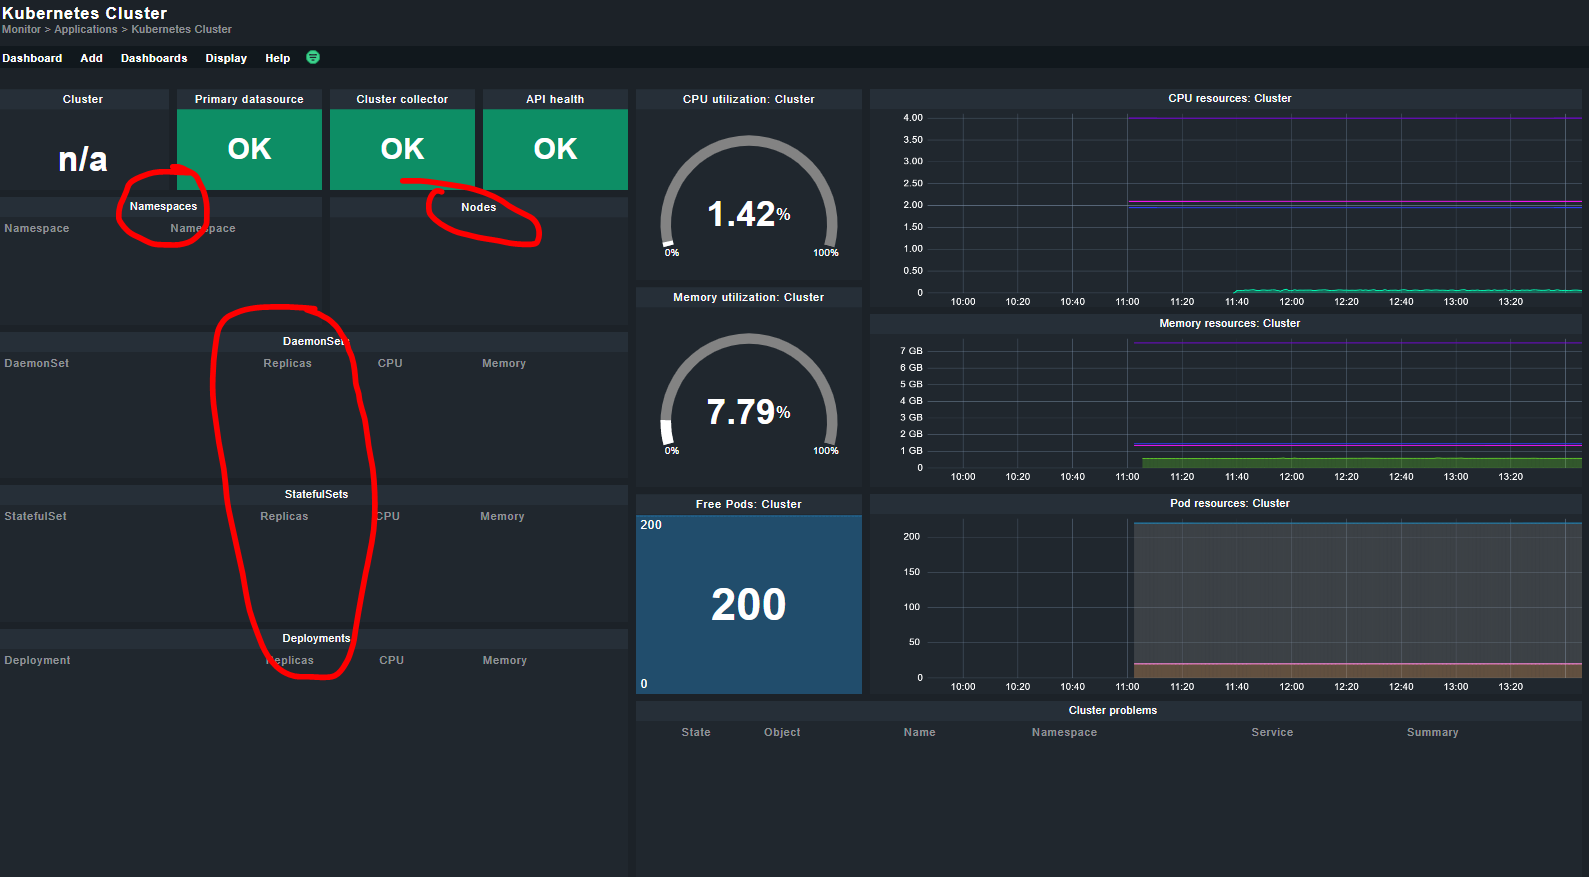
After I completely setup Kubernetes monitoring, and when I go to
Monitor–> Applications → Kubernetes Cluster all my data is listed except for Namespace, Nodes, DaemonSets…
All data related to CPU, Memory Pod resources: Cluster are displayed without any problems.
All services are up and OK.
Does anyone know what the trick is in order to display data related to namespaces and Nodes on the dashboard.
I did everything according to the instructions and everything went without a problem, I just don’t see all the things.
could you tell a bit more insights on what you did and how your environment looks like?
Have you installed the checkmk containers in your cluster, created a way to get the data out of the cluster (e.g ingress or node Port) and enabled the option " Enrich with usage data from Checkmk Cluster Collector"?
Hey,
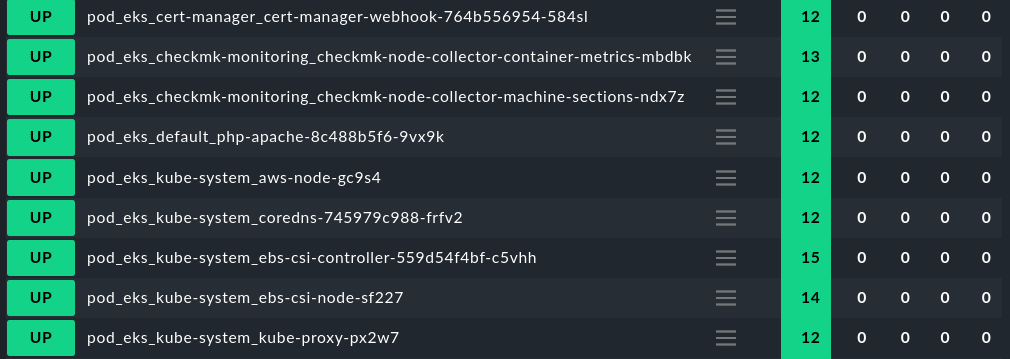
you have set it up correctly in general as the cluster collector is running (you can see the usage data for both CPU and Memory). Also the services show that the piggyback source host representing the cluster is set up properly.
I can spot two issues:
The hardware/software inventory of the piggyback source host is not up-to-date (otherwise it would show something in the field cluster)
The piggyback hosts are either
not created (probably the issue here)
don’t have the correct labels (this can only happen, if you did something completely non-standard)
Many many many thanks for your reply, since I`m beginner on CMK all information can help me.
Regardihg Dynamic host management:
I have this ERROR
ERROR An exception occured
Traceback (most recent call last):
File “/omd/sites/tamprod/lib/python3/cmk/cee/dcd/connectors/piggyback.py”, line 229, in _execute_phase2
cmk_hosts = self._web_api.get_all_hosts()
File “/omd/sites/tamprod/lib/python3/cmk/cee/dcd/web_api.py”, line 224, in get_all_hosts
resp = self._session.get(“/domain-types/host_config/collections/all”)
File “/omd/sites/tamprod/lib/python3.9/site-packages/requests/sessions.py”, line 600, in get
return self.request(“GET”, url, **kwargs)
File “/omd/sites/tamprod/lib/python3/cmk/cee/dcd/web_api.py”, line 129, in request
user_id, secret = self._credentials.for_api_call()
File “/omd/sites/tamprod/lib/python3/cmk/cee/dcd/models.py”, line 289, in for_api_call
return (user_id, self._read_secret(user_id))
File “/omd/sites/tamprod/lib/python3/cmk/cee/dcd/models.py”, line 298, in _read_secret
raise MKGeneralException(
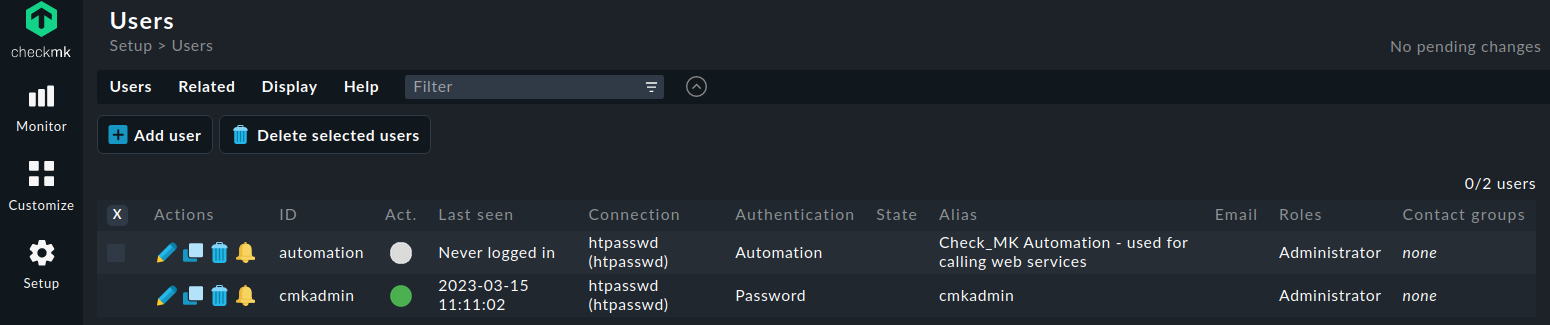
cmk.utils.exceptions.MKGeneralException: Secret could not be found. Maybe user ‘automation’ is missing.
Thanks for reply and your help,
I don`t see Automation user and never delete that user.
We have some automation user for service account but no user with name automatization.
Can you check your global settings “Connection to the Web API” setting ?
I had the same error in one of my sites where the account “automation” was set there and someone deleted that account.
I solved the problem with the DCD by just creating a new user “automation” as automation account and set a secret for it, or you could change the setting to your other automation account.
Hey Martin, just to let you know that problem was on Automation user, when I create this user all is fix and work as well
MANY MANY MANY thanks for that!!!
My takeaway: we should show a warning when someone deletes the automation user and add this as a check to Analyze configuration (Analyzing the Checkmk site configuration).
What do you think @aeckstein?
This topic was automatically closed 365 days after the last reply. New replies are no longer allowed. Contact an admin if you think this should be re-opened.