Linux Memory check with dynamic total RAM?

CMK version: 2.3.0p33cee
OS version: Debian 11

We just noticed that the Memory check has a very dynamic “Total RAM” metric.

As you can see in the graph the Total RAM oscillates between 5.91 GB and 9.43 GB.

This particular machine has a static amount of RAM configured.

Could it be that the Linux kernel reports different numbers?

That is a rrd problem for longer time periods you need to select the average value in the graph.
With longer I mean all more than 24 hours.

At the moment you see the maximum values from every interval after data consolidation.

From the top of my mind I think we fixed this in 2.4.0, maybe you can check, if you see the same thing on 2.4.0? :slight_smile:

We cannot upgrade to 2.4 as not all of our extensions are there yet
And migrating them is often not very easy or straight forward. As you can see in my other posts here.

1 Like

I need to solve some host’s OOM problems and I have taken a look to the Memory graphs a bit more than before. I run CRE 2.4.0p17 and what confuses me is varying value of Total RAM on Linux hosts. My idea was, that Total RAM should be the same as MemTotal of /proc/meminfo. But it is not. If I read the code correctly, Total RAM is computed by graphing code as

        Sum(
            Title("Total RAM"),
            Color.DARK_BLUE,
            (
                "mem_used",
                "mem_free",
                "mem_lnx_cached",
                "mem_lnx_buffers",
                "swap_cached",
                "sreclaimable",
            ),

Legacy mem_linux check code computes:

    section["Caches"] = (
        section["Cached"]
        + section["Buffers"]
        + section.get("SwapCached", 0)
        + section.get("SReclaimable", 0)
    )       
            
    # RAM, https://github.com/Checkmk/checkmk/commit/1657414506bfe8f4001f3e10ef648947276ad75d
    section["MemUsed"] = section["MemTotal"] - section["MemFree"] - section["Caches"]

The section keys are converted to underscored using (_camelcase_to_underscored()), so MemUsed is mem_used and so on in perfdata. There is also a bit confusing transition

        "buffers": translations.RenameTo("mem_lnx_buffers"),
        "cached": translations.RenameTo("mem_lnx_cached"),

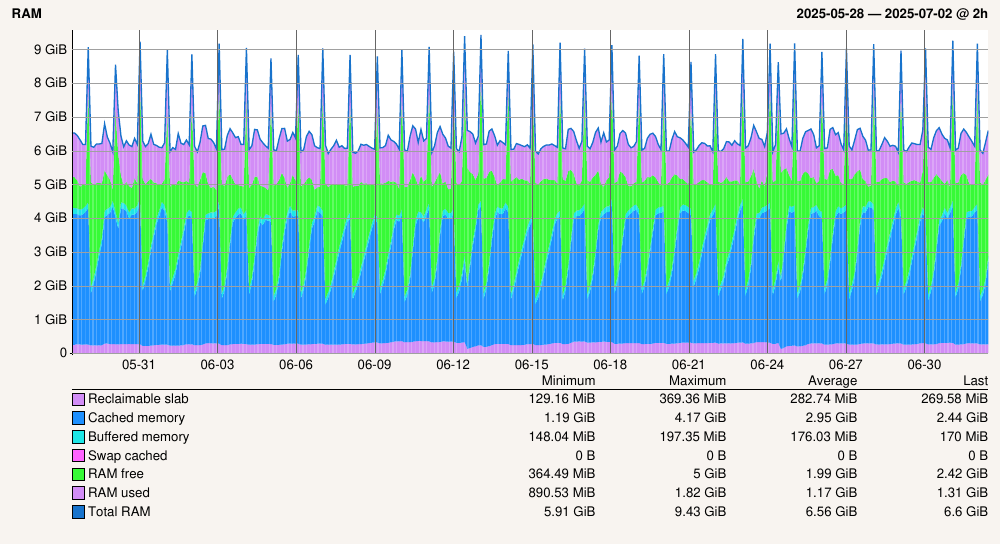
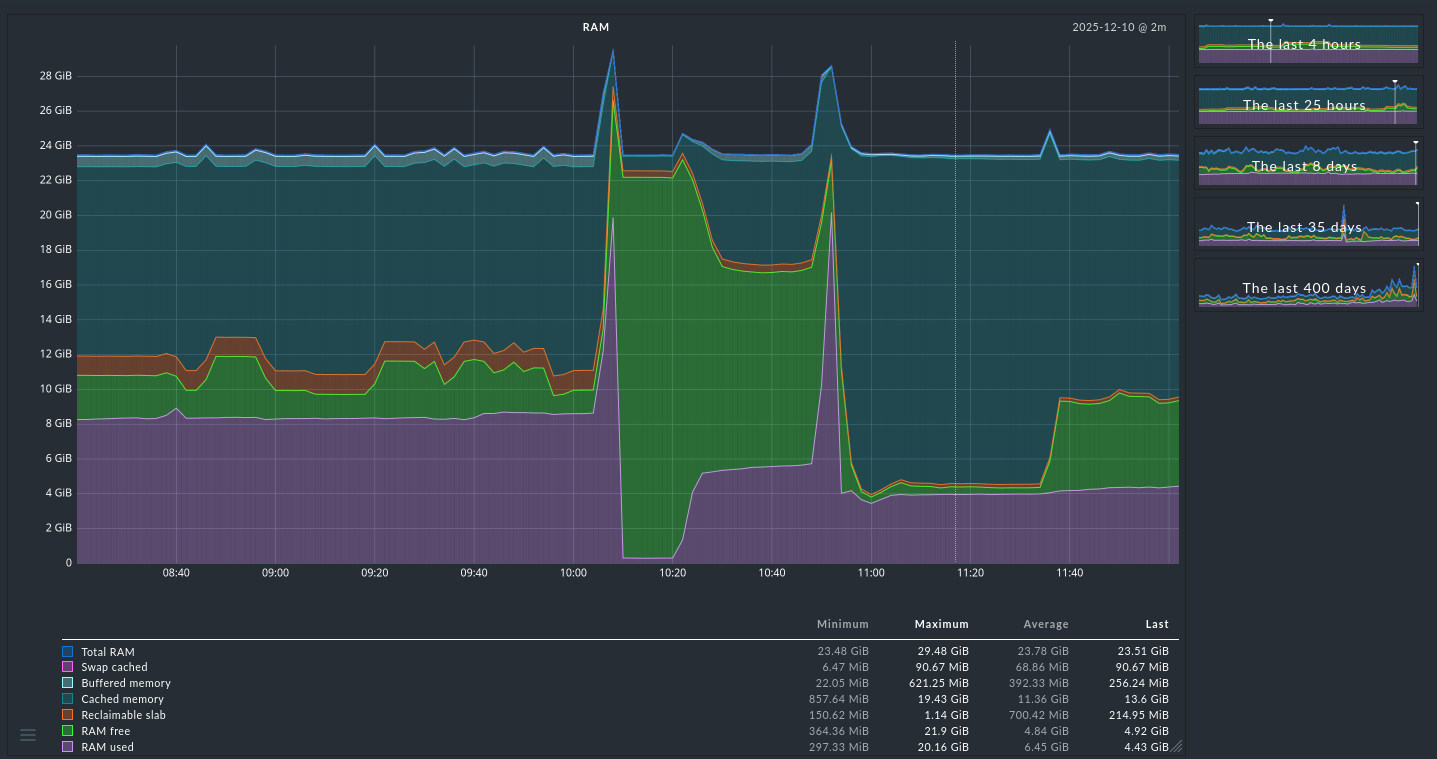
So I think the intention was really, that Total RAM should be MemTotal, but there are sometimes really big differences. Especially in the case of memory pressure, like OOM in the picture bellow.

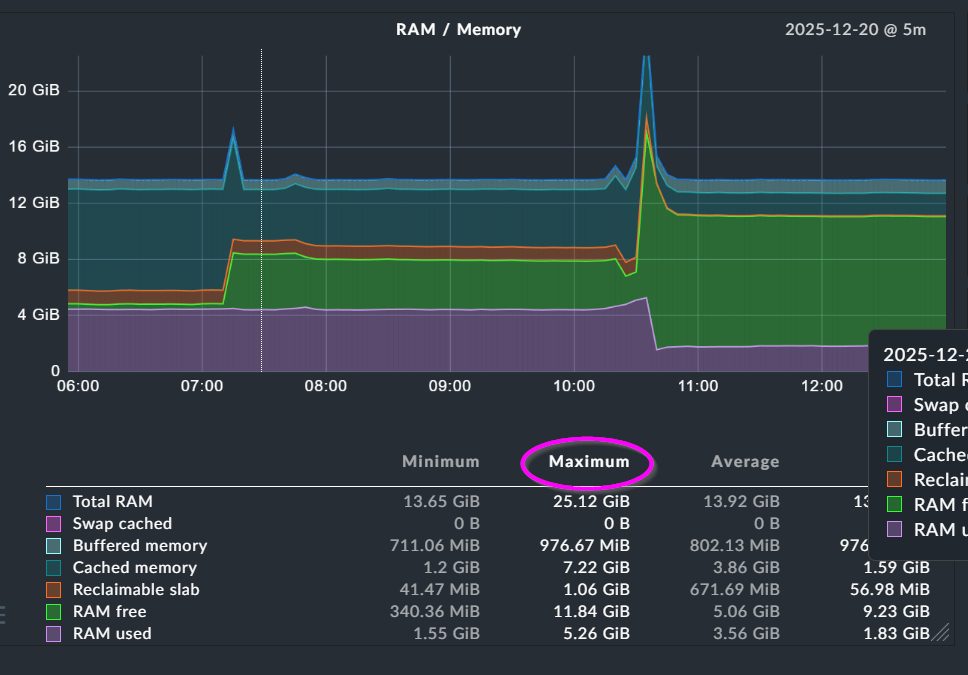
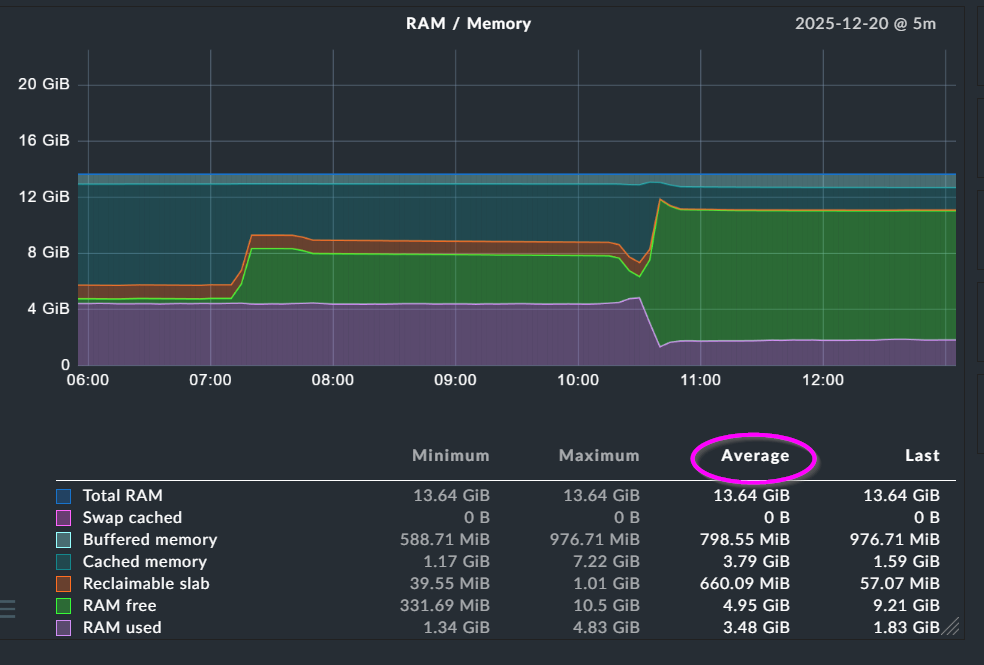
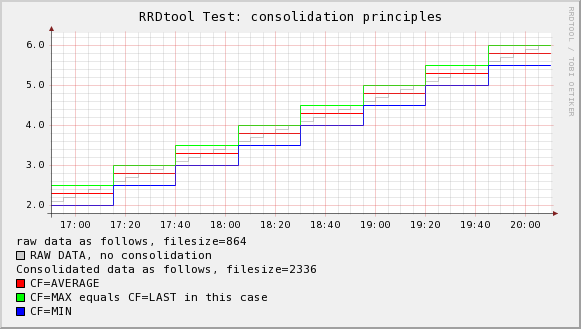
If such a combined graph has the possibility to select the “Average” column you should select it.
The problem is that in your graph already consolidated data is present and then you don’t need the maximum value over the consolidation time, but the average, to show a proper graph.
Here as example two times the same data.

Default selection - Maximum

Same graph but with “Average” selected. This shows the real data for the time displayed.

1 Like

Dear Andreas,
I thank you very much for the clear instructions!!! I didn’t know about the possibility to change the consolidation function :face_with_open_eyes_and_hand_over_mouth: in graphs this way.
Now it makes sense where is the problem with additions and subtractions.
You wrote this at the start already, sorry for my ignorance. On the other hand, this must be clear for everyone now. :blush:
Best regards!

1 Like

As addition this is a nice small graph showing the aggregation inside the RRD file.

1 Like