Checked that too, its not activated and i’m sure that the values in the webpage are correct.
I’m slowly getting to it. In LQ per default hosts/services which are in downtime are aswell counted. But this does not happen in the webpage, there are things in downtime separated.
Overview:
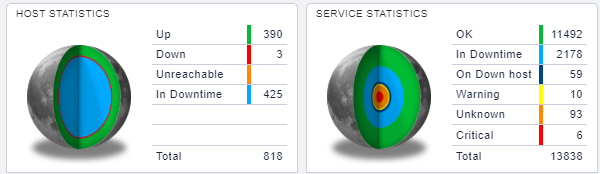
Get all Hosts in Downtime (correct):
OMD[site]:~$ lq "GET hosts\nStats: scheduled_downtime_depth > 0\n\nOutputFormat: json"
425
Get Sum of all Hosts without Hosts in Downtime:
OMD[site]:~$ lq "GET hosts\nStats: state = 0\nStats: state = 1\nStats: state = 2\nFilter: scheduled_downtime_depth = 0\nOutputFormat: json"
[[378,3,0]]
mhh - does not match. Okay, seems like lq calls only the numbers by one monitoring site (and not another distributed site)
OMD[slave]:~$ lq "GET hosts\nStats: state = 0\nStats: state = 1\nFilter: scheduled_downtime_depth = 0\nOutputFormat: json"
[[12,0]]
378 + 12 = 390 - Correct
Get all Services without Downtimes:
OMD[site]:~$ lq “GET services\nStats: state = 0\nStats: state = 1\nStats: state = 2\nStats: state = 3\nFilter: scheduled_downtime_depth = 0\nOutputFormat: json”
[[12945,56,103,374]]
add those from the distributed monitoring site:
OMD[slave]:~$ lq "GET services\nStats: state = 0\nStats: state = 1\nStats: state = 2\nStats: state = 3\nFilter: scheduled_downtime_depth = 0\nOutputFormat: json"
[[47,5,0,0]]
Checking for services:
OMD[site]:~$ lq "GET services\nStats: state = 0\nStats: state = 1\nStats: state = 2\nStats: state = 3\nFilter: scheduled_downtime_depth = 0\nOutputFormat: json"
[[12945,56,103,374]]
Okay that value is still to high, I guess we have to exclude services which are ok, but on a host in downtime.
OMD[site]:~$ lq "GET services\nStats: state = 0\nStats: state = 1\nStats: state = 2\nStats: state = 3\nFilter: scheduled_downtime_depth = 0\nFilter: host_scheduled_downtime_depth = 0\nOutputFormat: json"
[[11498,5,12,93]]
That values sound almost the same from the webgui 