Manager asked for a bit more color

After debating what monitoring software to use we finally decided on CheckMK and the implementation went very smooth

However my manager wanted the host overview to display as “green” if the Hosts are in the “OK” state. Apparently this was a nice feature of PRTG so he asked if it was possible to implement that.

So I created a new theme that does exactly that. It uses the default

colors in the CheckMK CI.

Imgur

Does anyone know how to make this an extension?

1 Like

Do not put your own files into $OMD_ROOT/share. Use the local hierarchy for that.

Files there can be included in extension packages.

Seems like it is best to make it a new theme in local/share/check_mk/web/htdocs/themes/

Some of my notes on themes can be found in following post:

4 Likes

Thank you for the reply, that clears a few things up.

However this bings up an issue i encountered.
When creating a “new” theme by creating a new folder in local/share/check_mk/web/htdocs/themes/ oder in $OMD_ROOT/share for that matter and just change one value for the hexagons, it screws with the legends of the default graphs on the dashboards.

It turns the legends black and makes them illegible.

Thank you for the point.
However i run into a strange problem with creating a new theme.
I copied the modern-dark folder to the corresponding omd/local directory and made a color value change.

This has no class,id or tag correlation with the graphs, it does change the legends of the graphs to black tho.

I don’t have Checkmk CI, don’t have similar hexagons with legend, so can’t test it myself.

Maybe you can share some page source code?

This is the affected area that was not changed in css, the timeline turns black. Same for all other graphs.

The HTML looks like this

<div style="font-size: 8pt; padding: 0ex; color: rgb(255, 255, 255);" class="graph"><canvas
        style="position: relative; width: 1595px; height: 143px;" width="3190.0" height="286.0"></canvas>
    <style>
        div.graph div.v_axis_label {
            color: rgba(255, 255, 255, 0.8);
        }

        div.graph div.time {
            color: rgba(255, 255, 255, 0.8);
        }

        div.graph table.legend th.scalar.inactive,
        div.graph table.legend td.scalar.inactive {
            color: rgba(255, 255, 255, 0.6);
        }

        div.graph table.legend th {
            border-bottom: 1px solid #ffffff;
        }

        div.graph table.legend th.scalar {
            color: #ffffff;
            border-bottom: 1px solid #ffffff;
        }

        div.graph a {
            color: #ffffff;
        }

        div.graph.preview .title {
            text-shadow: -1px 0 #000000, 0 1px #000000, 1px 0 #000000, 0 -1px #000000;
        }

        div.graph div.title.inline,
        div.graph div.time.inline {
            text-shadow: -1px 0 #000000, 0 1px #000000, 1px 0 #000000, 0 -1px #000000;
        }

        div.graph div.indicator {
            border-right: 1px dotted #ffffff;
        }
    </style>
</div>

The CSS in question i changed is the hex value in the following classes

div.alert_overview g.element_box.host_element path.hexagon.ok,
div.alert_overview path.hexagon.host_element.ok,
div.site_overview g.element_box.host_element path.hexagon.ok,
div.site_overview path.hexagon.host_element.ok,
div.stats_dashlet g.element_box.host_element path.hexagon.ok,
div.stats_dashlet path.hexagon.host_element.ok {
    fill:#13d389; !important
    stroke:none
}

Right now i worked around it by pushing the file into

omd:~/local/share/check_mk/web/htdocs/css

This will append the above mentioned CSS Code to the selected theme.css.
That should make it a cleaner implementation, however a seperate theme, or a siwtchable extension would be preferable.

reply above, sorry im still getting acustomed to this forum

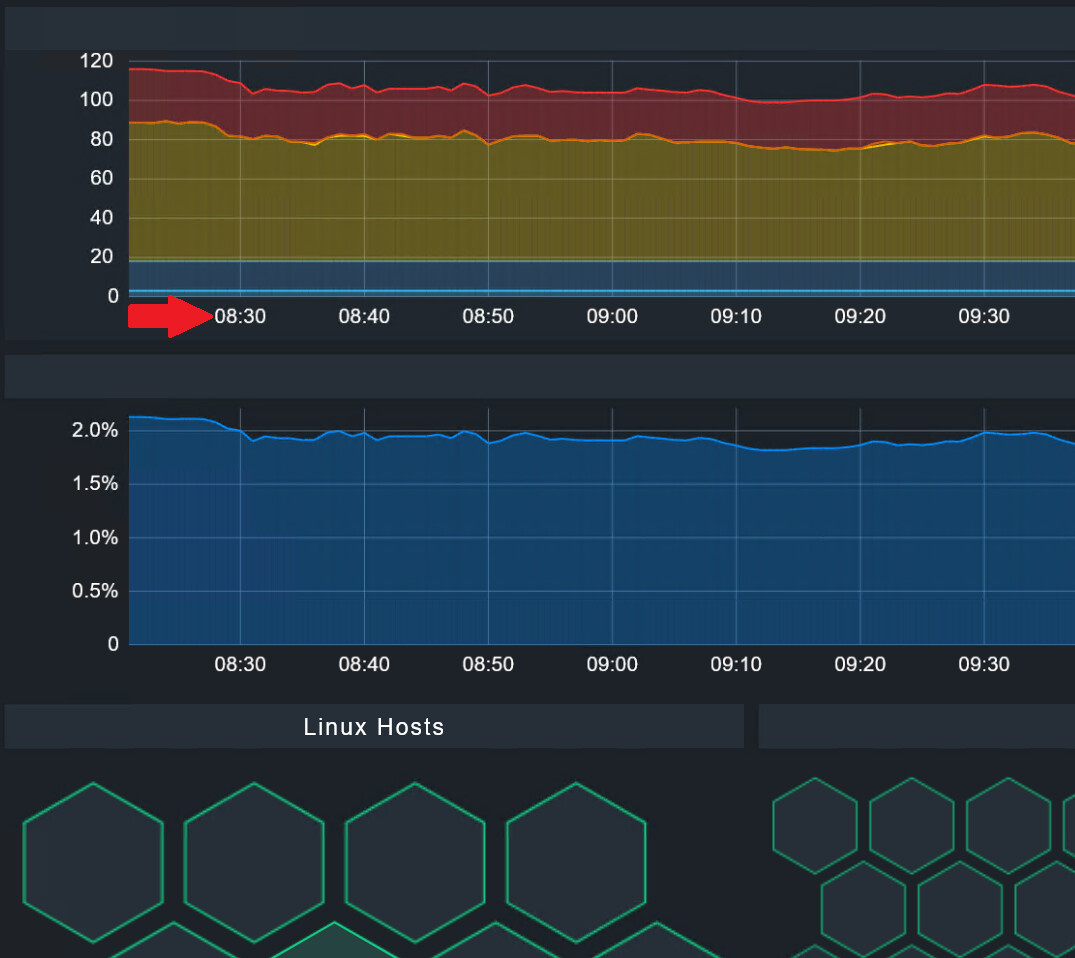
Made a change in my dashboard so there is a test performance graph visible.

In the default Dark theme, the legend text is white.
image

When I go for my custom theme, the legend text is also black.
image

So it seems It is unrelated to your svg style changes, but related to making a new theme.

I’m guessing there’s something missing in our themes to make canvas texts the white colour and it’s borrowing it from the light theme instead. Have not figured it out, but when I got the time will look into it further.

Edit:
Canvas for graphs have inline styles.

Default dark theme:

div.graph div.v_axis_label {
color: rgba(255, 255, 255, 0.8);
}
div.graph div.time {
color: rgba(255, 255, 255, 0.8);
}
div.graph table.legend th.scalar.inactive, div.graph table.legend td.scalar.inactive {
color: rgba(255, 255, 255, 0.6);
}
div.graph table.legend th {
border-bottom: 1px solid #ffffff;
}
div.graph table.legend th.scalar {
color: #ffffff;
border-bottom: 1px solid #ffffff;
}
div.graph a {
color: #ffffff;
}
div.graph.preview .title {
text-shadow: -1px 0 #000000, 0 1px #000000, 1px 0 #000000, 0 -1px #000000;
}
div.graph div.title.inline, div.graph div.time.inline {
text-shadow: -1px 0 #000000, 0 1px #000000, 1px 0 #000000, 0 -1px #000000;
}
div.graph div.indicator {
border-right: 1px dotted #ffffff;
}

Default light theme:

div.graph div.v_axis_label {
color: rgba(0, 0, 0, 0.8);
}
div.graph div.time {
color: rgba(0, 0, 0, 0.8);
}
div.graph table.legend th.scalar.inactive, div.graph table.legend td.scalar.inactive {
color: rgba(0, 0, 0, 0.6);
}
div.graph table.legend th {
border-bottom: 1px solid #000000;
}
div.graph table.legend th.scalar {
color: #000000;
border-bottom: 1px solid #000000;
}
div.graph a {
color: #000000;
}
div.graph.preview .title {
text-shadow: -1px 0 #ffffff, 0 1px #ffffff, 1px 0 #ffffff, 0 -1px #ffffff;
}
div.graph div.title.inline, div.graph div.time.inline {
text-shadow: -1px 0 #ffffff, 0 1px #ffffff, 1px 0 #ffffff, 0 -1px #ffffff;
}
div.graph div.indicator {
border-right: 1px dotted #000000;
}

New themes get default light theme inline styles assigned.
Did some quick tests with Stylus browser add on and I’m unable to override it with !important property. )-: Maybe, I’m missing something, but currently clueless.

div.graph div.v_axis_label {
color: rgba(255, 255, 255, 0.8) !important;
}
div.graph div.time {
color: rgba(255, 255, 255, 0.8) !important;
}
div.graph table.legend th.scalar.inactive, div.graph table.legend td.scalar.inactive {
color: rgba(255, 255, 255, 0.6) !important;
}
div.graph table.legend th {
border-bottom: 1px solid #ffffff !important;
}
div.graph table.legend th.scalar {
color: #ffffff !important;
border-bottom: 1px solid #ffffff !important;
}
div.graph.preview .title {
text-shadow: -1px 0 #000000, 0 1px #000000, 1px 0 #000000, 0 -1px #000000 !important;
}
div.graph div.title.inline, div.graph div.time.inline {
text-shadow: -1px 0 #000000, 0 1px #000000, 1px 0 #000000, 0 -1px #000000 !important;
}
div.graph div.indicator {
border-right: 1px dotted #ffffff !important;
}

Edit2
The inline styles are made by main_min.js according to following javascript snippet:

function update_graph_styling(t, e) {
    var n = e.getElementsByClassName("graph")[0];
    if (n) {
        n.style.color = t.render_options.foreground_color;
        for (var r = render_color(invert_color(parse_color(t.render_options.foreground_color))), i = document.createElement("style"), o = [{
                    selector: "div.graph div.v_axis_label",
                    attrs: {
                        color: render_color_rgba(parse_color(t.render_options.foreground_color), .8)
                    }
                }, {
                    selector: "div.graph div.time",
                    attrs: {
                        color: render_color_rgba(parse_color(t.render_options.foreground_color), .8)
                    }
                }, {
                    selector: "div.graph table.legend th.scalar.inactive, div.graph table.legend td.scalar.inactive",
                    attrs: {
                        color: render_color_rgba(parse_color(t.render_options.foreground_color), .6)
                    }
                }, {
                    selector: "div.graph table.legend th",
                    attrs: {
                        "border-bottom": "1px solid " + t.render_options.foreground_color
                    }
                }, {
                    selector: "div.graph table.legend th.scalar",
                    attrs: {
                        color: t.render_options.foreground_color,
                        "border-bottom": "1px solid " + t.render_options.foreground_color
                    }
                }, {
                    selector: "div.graph a",
                    attrs: {
                        color: t.render_options.foreground_color
                    }
                }, {
                    selector: "div.graph.preview .title",
                    attrs: {
                        "text-shadow": "-1px 0 " + r + ", 0 1px " + r + ", 1px 0 " + r + ", 0 -1px " + r
                    }
                }, {
                    selector: "div.graph div.title.inline, div.graph div.time.inline",
                    attrs: {
                        "text-shadow": "-1px 0 " + r + ", 0 1px " + r + ", 1px 0 " + r + ", 0 -1px " + r
                    }
                }, {
                    selector: "div.graph div.indicator",
                    attrs: {
                        "border-right": "1px dotted " + t.render_options.foreground_color
                    }
                }
            ], a = "", s = 0, u = o.length; s < u; s++) {
            var c = o[s];
            for (var l in a += c.selector + " {\n", c.attrs)
                a += l + ": " + c.attrs[l] + ";\n";
            a += "}\n"
        }
        i.innerHTML = a,
        n.appendChild(i)
    }
}

Variable t.render_options.foreground_color is set elsewhere. I assume it is set in the javascript before the canvas.

Sadly, my Web Developer Tools keeps crashing while I try to debug the code, so not making much progress and my weekend is starting in a bit. :laughing:

That is VERY comprehensive so far.
My Web Development skills are way lower than that :slight_smile:

Enjoy your weekend

Was digging further today, before the canvas a javascript is placed, which among other things, sets the foregroundcolor:

<script type="text/javascript">
	cmk.graphs.load_graph_content({},{} //censored first 2 arrays
	,{
		"font_size": 8.0,
		"resizable": true,
		"show_controls": true,
		"show_pin": true,
		"show_legend": true,
		"show_graph_time": true,
		"show_vertical_axis": true,
		"vertical_axis_width": "fixed",
		"show_time_axis": true,
		"show_title": true,
		"title_format": ["plain"],
		"show_margin": true,
		"preview": false,
		"interaction": true,
		"editing": false,
		"fixed_timerange": false,
		"show_time_range_previews": true,
		"background_color": null,
		"foreground_color": "#000000",
		"canvas_color": null,
		"size": [70.27272727272725, 17.45454545454546]
	})
</script>

However couldn’t find the setting which changes this value with the default light theme facelift and dark theme modern-dark.

New themes seems to get the default light theme settings for canvas graphs. )-:

Did find 2 werks regarding the color options being removed from the user interface.

I added a feature request to be able to set this again, (currently waiting for approval):

Edit1
Oh, following purple lined texts and border could be styled with css:

div.graph div.time {
	color: rgba(255, 255, 255, 0.8);
}
div.graph table.legend th, div.graph table.legend th.scalar {
	color: #fff;
	border-bottom: 1px solid #fff;
}