Hi, i’ve added Meraki switches to our monitoring and i’m going to be adding the WAPs also from the Meraki portal.
Our version is 2.1.0p35.
What are the differences in version 2.2, I read there would be new Meraki portal monitoring? But I can’t find specific documentation showing me the new features in 2.2 relating to Meraki monitoring.
I want to know what I could be getting on version 2.2 compared with how I am currently monitoring the Meraki switches individually using SNMP.
with 2.2 we’ve added a Meraki special agent that retrieves some additional information via the Meraki API. The actual monitoring of the devices is still done via SNMP.
@Quazmoz as usual, it’s a matter of prioritization. With 2.3 we added a few things to the Meraki agent afaik. I am sure there’s a long list of additional things, but whether those make the cut for 2.4 I’m the wrong person to answer. Not sure if anyone can, at this point.
As always: Putting an idea here is a good starting point - the more support it gets here, the more likely it becomes that it’s implemented: https://ideas.checkmk.com/
This is a little bit complicated. Not to fetch the data but the amount of requests needed to get these data. If you have only a small number of device then it would be possible but not for larger installations.
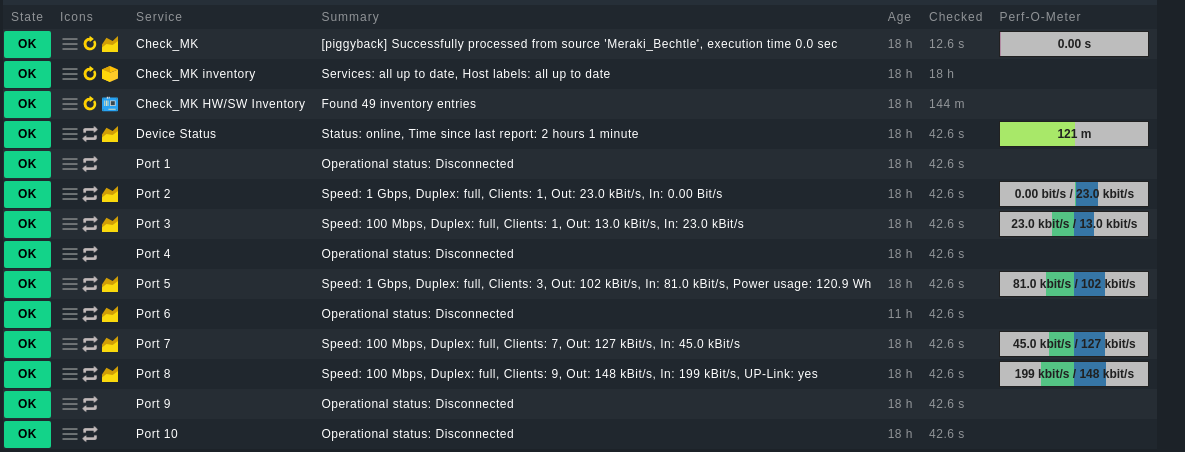
@Quazmoz Here Cisco Meraki special agent you can find an enhanched version of the Meraki agent. With this you can out of the box get the port status (up/down, speed, duplex, …) of your switches.
I have also started to add the traffic counters (in/out). Whether that works depends on the number of devices you need to check. As @andreas-doehler already wrote, there are rate limits for the Meraki API. This basically allows you to check 60 devices per check interval (1min.). New is a second option for the switch ports, where you can retrieve all port data with one API request. Theoretically, you could therefore check as many devices as you like. I guess the limit here is the time it takes to retrieve and process the data.
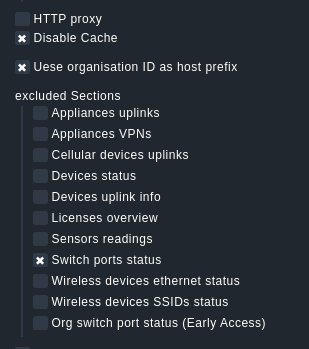
To use the second option you need to enable the Early Access feature for you organization(s) in the Meraki Dashboard. In the special agent you need to exclude the Switch ports status section and use the Org switch port status (Early Access) section instead. Also you need to disable the agent cache for both variants…
Note: the Early Access options if brand new. So it might need some work.
This topic was automatically closed 365 days after the last reply. New replies are no longer allowed. Contact an admin if you think this should be re-opened.