hi @ all,
maybe someone can help me with the following. I have this custom graph and it looks fine
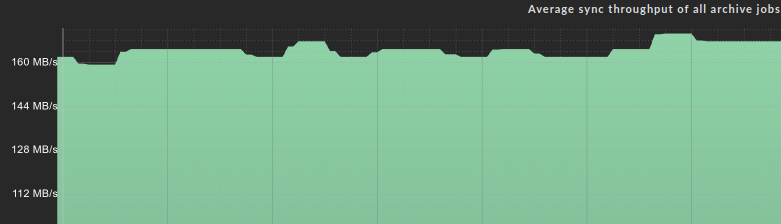
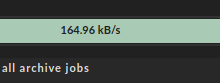
but the perf-o-meter shows kB/s and not MB/s
my custom graph definition looks like this
metric_info[“average_throughput”] = {
“title” : _(“Average sync throughput of all archive jobs”),
“unit” : “bytes/s”,
“color” : “#90D4A9”,
“scale” : KB,
}
perfometer_info.append({
“type” : “linear”,
“scale” : KB,
“segments” : [ “average_throughput” ],
})
but it looks like the scale in the perfometer_info section is not working
the performance data looks like this “average_throughput=168919;;;;”
somebody has an idea?
