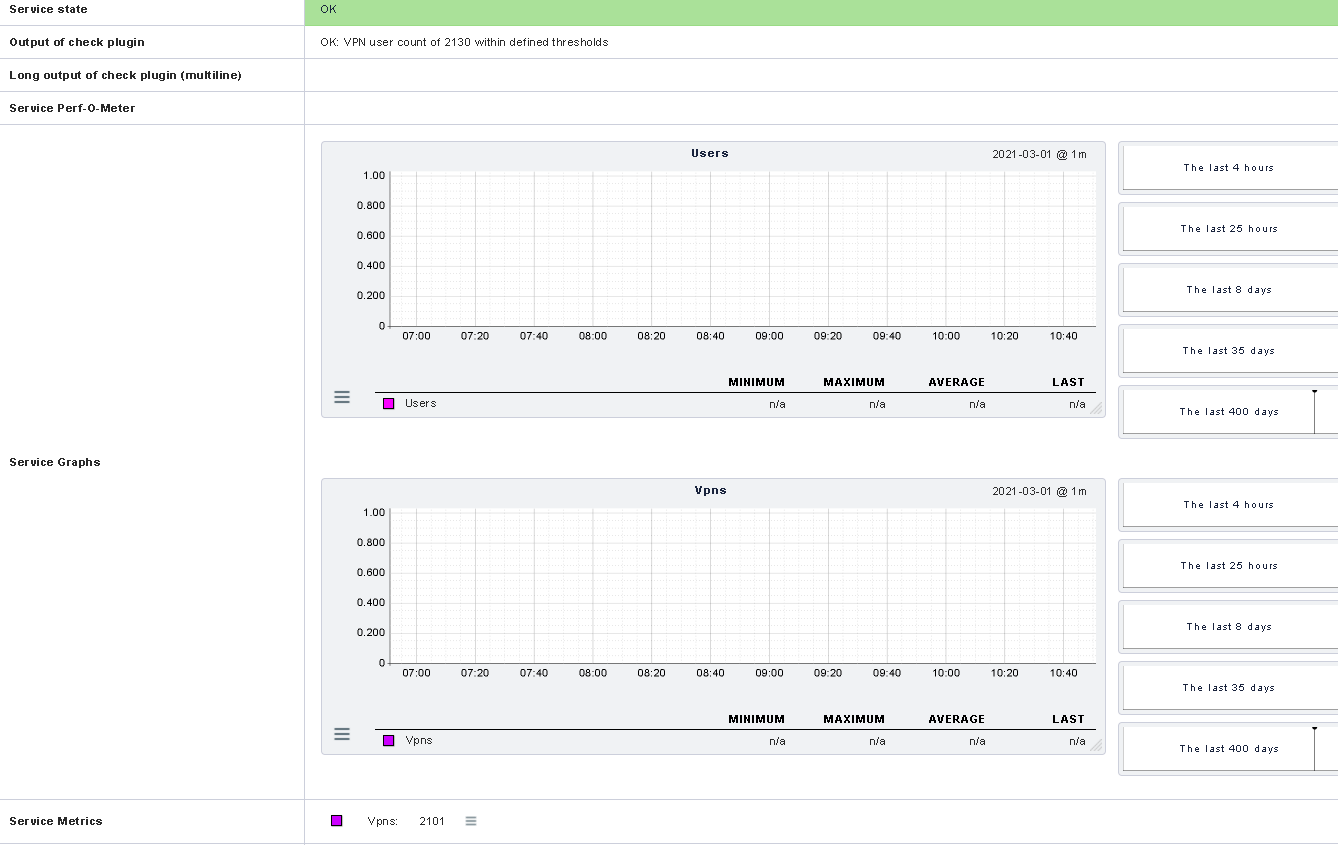
Well…I found the solution. Where i was passing performance data as “users=$RESULT,vpns=$VPNCOUNT”, i had to change and remove the comma to “users=$RESULT vpns=$VPNCOUNT”, and then it started working.
So, if like me, you wrote your scripts as per the guide for Nagios…you might also have put in a comma…
Plugin Performance Data
At a minimum, Nagios plugins must return a single line of human-readable text that indicates the status of some type of measurable data. For example, the check_ping plugin might return a line of text like the following:
PING ok - Packet loss = 0%, RTA = 0.80 ms
With this simple type of output, the entire line of text is available in the $HOSTOUTPUT$ or $SERVICEOUTPUT$ macros (depending on whether this plugin was used as a host check or service check).
Plugins can return optional performance data in their output by sending the normal, human-readable text string that they usually would, followed by a pipe character (|), and then a string containing one or more performance data metrics. Let’s take the check_ping plugin as an example and assume that it has been enhanced to return percent packet loss and average round trip time as performance data metrics. Sample output from the plugin might look like this:
PING ok - Packet loss = 0%, RTA = 0.80 ms | percent_packet_loss=0, rta=0.80
When Nagios sees this plugin output format it will split the output into two parts:
- Everything before the pipe character is considered to be the “normal” plugin output and will be stored in either the $HOSTOUTPUT$ or $SERVICEOUTPUT$ macro
- Everything after the pipe character is considered to be the plugin-specific performance data and will be stored in the $HOSTPERFDATA$ or $SERVICEPERFDATA$ macro
In the example above, the $HOSTOUTPUT$ or $SERVICEOUTPUT$ macro would contain “PING ok - Packet loss = 0%, RTA = 0.80 ms” (without quotes) and the $HOSTPERFDATA$ or $SERVICEPERFDATA$ macro would contain “percent_packet_loss=0, rta=0.80” (without quotes).