I am trying to figure a way to monitor my switch port state when a loop occurs. My switch is an Aruba 2930F. When I test and create a loop on purpose my switch ports change their Port State BpduError.
This is exactly what I want to monitor when a port change it’s state to BpduError.
So far I have tried to create a custom rule for OID STP - 1.3.6.1.2.1.17.2.15.1.3 but it’s either timeout or could not get data.
check_snmp -H 192.168.11.19 -p public -o 1.3.6.1.2.1.17.2.15.1.3
For mine: -H $HOSTADDRESS$ Host name, IP Address, or unix socket (must be an absolute path) and using macro -o 1.3.6.1.4.1.1347.43.5.1.1.28.1 Object identifier(s) or SNMP variables whose value you wish to query -P 2c SNMP protocol version, expects: 1, 2c or 3 -C public Optional community string for SNMP communication (default is “public”)
For yours:
assuming public had to be prefixed with -C
and maybe missing portnr for -p --port=INTEGER Port number (default: 161)
If not only the BPDU counter is affected it is possible that this also shows the problem.
Or you can adapt the STP plugin für the BPDU counter.
This plugin uses the same table as your counter only another value.
Your OID can’t be found. Assuming the iso. prefix is at fault.
So command should probably be: check_snmp -H 192.168.11.19 -C public -P 2c -o 1.3.6.1.2.1.17.2.15.1.3
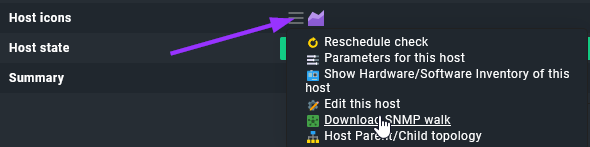
If not, go to the host status page of your switch. From the host icon hamburger menu there is an option to download the SNMP walk.
When you download that, it will give you all available OID and their current status of your switch. Check if your OID can be found there.
I mostly search for values in the SNMP device own status & config site to look for those that are interesting in the walk export and so try to find OIDs belonging to it.
In the walk export the OIDs have a prefix point, in the command you should omit that prefix point.
Thanks. I did SNMP walk and downloaded the file. Unfortunately the OID i am looking for is not available. I guess what I want to do, is not that simple?
I have no knowledge about Aruba, STP and that error, but maybe download the walk when the BpduError is active, so you can search for it in the walk export and find the correct OID.
That was exactly what I was looking for when I downloaded the walk. I have compared my switch log when the loop occurred and the walk, need to cross check them once again.
Possibly the BpduError isn’t the real error output, but some code that gets translated in your switch log to make it more human readable. If the Aruba has a web browser interface, the error can be found there as well and give hints where or what to look for.
RMON-MIB::logDescription.840.7 = STRING: W 09/15/22 09:42:49 00840 stp: port 5 disabled - BPDU received on protected port.
RMON-MIB::logDescription.840.8 = STRING: W 09/15/22 09:42:49 00840 stp: port 4 disabled - BPDU received on protected port.
Then I tried to execute the raw snmp query from the Check MK but I got the following message.
SNMPv2-SMI::mib-2.16.9.2.1.4.840 = No Such Intance currently exists at this OID.
Not sure how to proceed from here. Maybe I need to upload the switch MiB to check_mk?
The problem is really simple. You first command is an “snmpget” on a table OID. This must fail.
And you manual check is an “snmpwalk”, this should work.
check_snmp is only usable on single OIDs not on tables.
It’s because the BRIDGE-MIB/rfc4188.mib for some reason is missing the OID which I need. I have even uploaded the rfc4188.mib to in /opt/omd/sites/v2testing/local/share/check_mk/mibs and still when I try to use it it gives me the No Such Instance currently exists at this OID.
Maybe I need to load the MIB first? I am not sure. Any pointers?
MIB files are only for you to get readable descriptions instead of OID’s.
If you device don’t provide the OID’s you want then you have bad luck.
The monitoring system don’t need any MIB file for the monitoring it is only used inside CMK to translate the OID’s inside the EventConsole.
This topic was automatically closed 365 days after the last reply. New replies are no longer allowed. Contact an admin if you think this should be re-opened.