Team, i want steps to setup meraki & redis dashboard. kindly help on this and check the below points.
Steps followed for Redis:
After enabling the mk_redis plugin, we observed only three service alerts.
Persistence
number of connected clients
Redis server info
Note: For Kubernetes, after following the Checkmk documentation for configuration, we were able to observe all metrics—including CPU, memory, and pod details—in a single dashboard. However, for Redis, there is no option to view all metrics in a unified dashboard.
Steps followed for Meraki:
Installed the special agent mkp file for Meraki on the OMD server.
Enabled the API in Cisco Meraki rules.
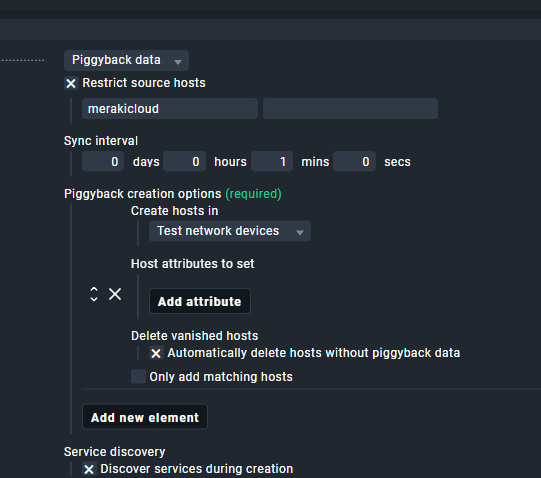
Created a host without an IP (Host name: merakicloud).
Enabled the dynamic host rule.
Dynamic Host Rule:
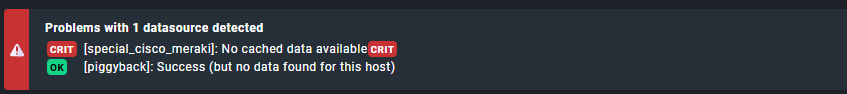
After completing the above steps, we performed a service discovery. However, we encountered the following error:
CRIT [special_cisco_meraki]: No cached data available CRIT
I want to know where i can place the meraki special agent mkp file.
and required details how to setup redis dashboard all metrices like master/slave, keys,I/O ,Memory usuage etc…
Questions:
For Redis, After mk_plugin enabled, its showing all metric details in cli but UI discovered only three alerts as I mentioned in the top line steps followed for redis.
For meraki is there any required special agent or only API rules to be configure ?