I am currently setting up monitoring in our company network with checkmk. So far it’s been a smooth ride and all switches/APs/servers were fairly easy to add.
Nonetheless I wasn’t able to monitor our dell powerstore storage. It uses snmp push method which I was not sure how to set up so I tried to find an API integration like the one which worked for my ESXi infrastrukture.
I found the following extention package: Checkmk Exchange, but I was not able to setup the API integration.
I got a 403 client error as you can see from the attached screenshot.
Upon some research I noticed that some other users stated that this extension is not working for dell powerstores.
Has anybody successfully integrated their dell powerstores into checkmk?
I would appreciate any advice/help.
The extension package you’re using isn’t for Dell PowerStores, it’s for Dell Storage Manager, which is a different product.
The PowerStore Manager has an API but I don’t think anyone has written a custom package to query it yet. The redfish idea is good but I’m not sure if the PowerStores themselves have redfish.
My client is using PowerStore 5000Ts, which are being managed by PowerStore Manager. The arrays send SNMP traps (unfortunately SNMP get is not supported) which you configure via Settings > Networking > SNMP on the PowerStore manager. Set the network name to your checkmk server. Change the minimal severify of alerts based on how much ‘noise’ you can handle. Info may be too much!
In Checkmk, you then need to configure the Event Console to receive SNMP traps from your environment and parse them.
Once traps are being received you’ll want to translate the raw traps into more meaningful info. To do this, download the PowerStore MIB from dell.com (info here: How to find Dell Management Information Base (MIB) files? | Dell UK) and upload that into Checkmk via Setup > Event Console > Event Console > SNMP MIBs. There is also a rule (search for translate under setup) which you need to turn on to enable the translation.
So now you should have traps coming into the Event Console. You can create rules based on the trap text so teams are alerts if critical traps are received.
However, these traps will only exist in the event console. It’s nice to see the actual PowerStores as hosts within checkmk, so you can see at a glance their status. To associate the traps with hosts in Checkmk, you’ll need to create a host entry for each PowerStore node you want to monitor. Then go to Setup > Event Console > Rules and select Check event state in Event Console. Create a rule to match the hosts with Hostname and IP address. Checkmk will then display the SNMP trap status (and whether they’ve been acknowledged) as as a service within the host. You can probably set checkmk to ping the nodes and setup parent/child relationship with the cluster, but i’ve not done that yet.
Thanks for that! I’m happy to give back, as you’re right, I’ve been lurking around here for about 9 months, trying to learn as much as I can about Checkmk! The product is so flexible and powerful that sometimes it can be confusing to understand the concepts and error messages - this forum has been a helping hand.
I’m new to Checkmk, but I wrote a Nagios compatible perl script that monitors the hardware on a PowerStore 500T via the API.
The script is available to dowload from Nagios exchange.
I have tested it in Checkmk 2.3.0p14.cce, and it works when I use Nagios integration.
Hi @zito,
just found your plugin and it works very well.
We are new to PowerStore, so its cool we have them in CMK because SNMP did not work.
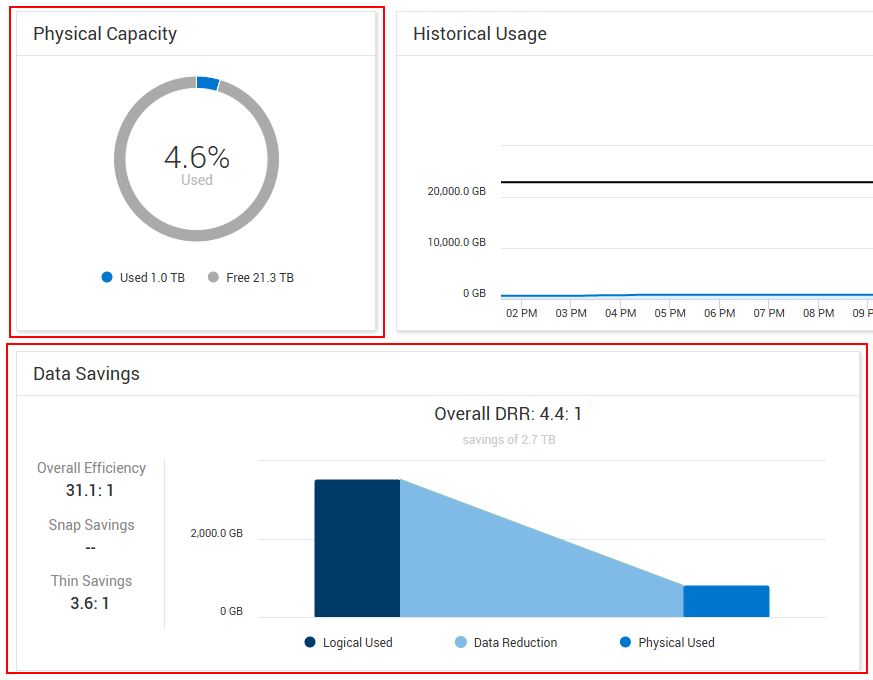
But i am missing some infos… and because i have zero competence in RestAPI and programming, may its possible for you I am missing overall capacity infomation like in the dashboard of the PowerStore WebGUI (we have 1200Ts).
“Physical Capacity” would be great and “Data Savings” would be nice
@zito in the Dell Community one asked the same question and get answers. Here and here.
I have seen there is also a category by cluster.
May you have time and interesst to expand the plugin
For alpha / beta testing i am here! And if you need a cup of offee or a beer we get that managed
Hi, I just uploaded a version 1.3.0 to github and cmk exchange. It should solve the problem during CMK upgrades. I removed service parameters causing problems. The hardware items are now separate services. Physical space is monitored. The plugin should be upgraded and hosts that use it reinventorized. Maybe the rule with REST API credentials may need recreation. My knowledge of CMK plugin API is limited, sorry. Hope it will be a bit more useful…
Hey,
I’m a bit new to checkmk. I use CheckMK Raw and installed and enabled the .mkp file. Can you explain me what else I have to do to monitor my powerstore? I’m a bit curiouse how to use the plugin on the host I created. Can you support me?
Hi, you should create a monitoring account on your device with minimal privileges. Then setup this access credentials in CMK. Go to Setup → Agents → Other integrations → Dell PowerStore and add a rule with your credential. If you leave checked the box Check SSL certificate (recommended) you have to download ssl certificate from your device and place it into your system PKI repository. For example I placed this file into /usr/local/share/ca-certificates/<my-host-name>.crt and ran update-ca-certificates afterwards. This is the possible way on Debian GNU/Linux. It is system dependent and may differ for your operating system. Hope this helps
@zito The Plugin is working great with our T1200s, i got a lot of hardware infos now.
But not the infos i would like to have in CMK
Like shown in the pic in my post from 19, march.
Thank you so much for this really good and quick support!!
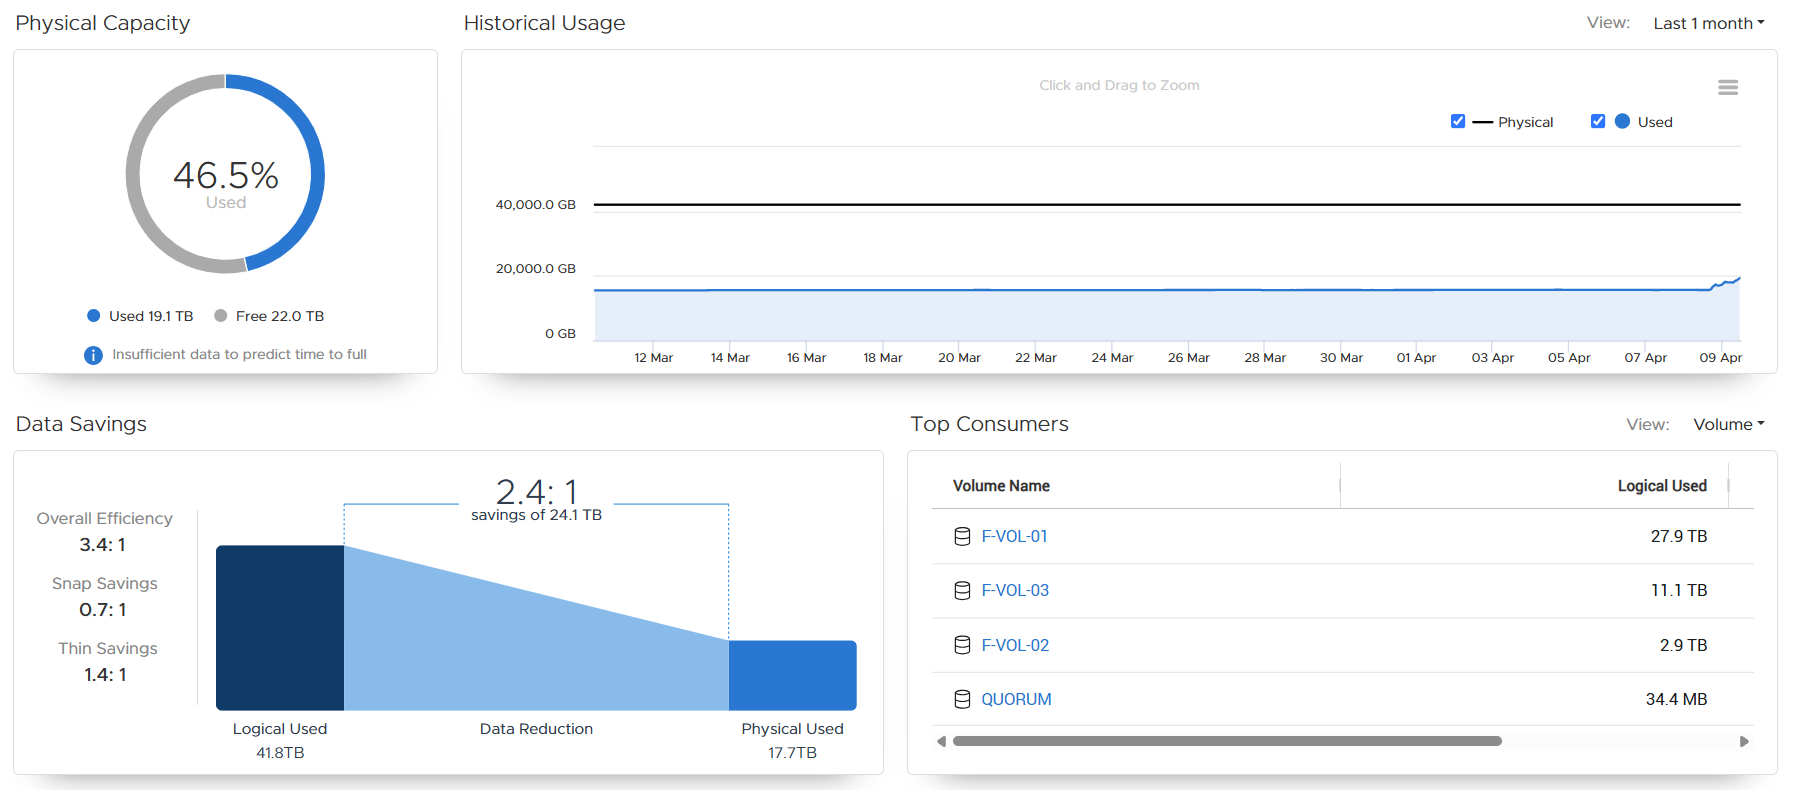
Is there a way I can see the Physical available Space? The discovered services show me my created volumes what is great, but would be nice to see also the physical used space. See my screenshots below <3