CMK version: raw 2.3.0p3
OS version: Ubuntu 22.04
Hello everyone,
I’m trying to monitor a FreeBSD server in 12.2 (yeah i know…). I install the agent and after some multiple troubles and time, it finally work. I’m not aware of FreeBSD system.
However, some information are missing like interface (the interface itself and in and out transit).
The output of the section “netctr” of the checkmk agent isn’t empty :
<<<netctr>>>
1716906744
vmx0 856428279293 2330869335 0 0 0 0 0 0 317293190758 948347234 0 0 0 0 0 0
But in the interface of Checkmk server, there is no interface in it.
It’s annoying me because this is the principal service I need because this system is our proxy that we want to replace but we need a traffic estimation for quote the next solution.
Output of “cmk --debug -vvn hostname”:
value store: synchronizing
Trying to acquire lock on /omd/sites/mysite/tmp/check_mk/counters/myhostname
Got lock on /omd/sites/mysite/tmp/check_mk/counters/myhostname
value store: loading from disk
Releasing lock on /omd/sites/mysite/tmp/check_mk/counters/myhostname
Released lock on /omd/sites/mysite/tmp/check_mk/counters/myhostname
Checkmk version 2.3.0p3
+ FETCHING DATA
Source: SourceInfo(hostname='myhostname', ipaddress='xxx.xxx.xxx.xxx', ident='agent', fetcher_type=<FetcherType.TCP: 8>, source_type=<SourceType.HOST: 1>)
[cpu_tracking] Start [7f76cf7afda0]
Read from cache: AgentFileCache(myhostname, path_template=/omd/sites/mysite/tmp/check_mk/cache/{hostname}, max_age=MaxAge(checking=0, discovery=90.0, inventory=90.0), simulation=False, use_only_cache=False, file_cache_mode=6)
Not using cache (Too old. Age is 44 sec, allowed is 0 sec)
Connecting via TCP to xxx.xxx.xxx.xxx:6556 (5.0s timeout)
Detected transport protocol: TransportProtocol.PLAIN
Reading data from agent
Closing TCP connection to xxx.xxx.xxx.xxx:6556
Write data to cache file /omd/sites/mysite/tmp/check_mk/cache/myhostname
Trying to acquire lock on /omd/sites/mysite/tmp/check_mk/cache/myhostname
Got lock on /omd/sites/mysite/tmp/check_mk/cache/myhostname
Releasing lock on /omd/sites/mysite/tmp/check_mk/cache/myhostname
Released lock on /omd/sites/mysite/tmp/check_mk/cache/myhostname
[cpu_tracking] Stop [7f76cf7afda0 - Snapshot(process=posix.times_result(user=0.0, system=0.0, children_user=0.0, children_system=0.0, elapsed=0.09999999776482582))]
Source: SourceInfo(hostname='myhostname', ipaddress='xxx.xxx.xxx.xxx', ident='piggyback', fetcher_type=<FetcherType.PIGGYBACK: 4>, source_type=<SourceType.HOST: 1>)
[cpu_tracking] Start [7f76d0e3b800]
Read from cache: NoCache(myhostname, path_template=/dev/null, max_age=MaxAge(checking=0.0, discovery=0.0, inventory=0.0), simulation=False, use_only_cache=False, file_cache_mode=1)
No piggyback files for 'myhostname'. Skip processing.
No piggyback files for 'xxx.xxx.xxx.xxx'. Skip processing.
Get piggybacked data
[cpu_tracking] Stop [7f76d0e3b800 - Snapshot(process=posix.times_result(user=0.0, system=0.0, children_user=0.0, children_system=0.0, elapsed=0.0))]
[cpu_tracking] Start [7f76cffad820]
+ PARSE FETCHER RESULTS
<<<check_mk>>> / Transition NOOPParser -> HostSectionParser
<<<checkmk_agent_plugins_lnx:sep(0)>>> / Transition HostSectionParser -> HostSectionParser
<<<df>>> / Transition HostSectionParser -> HostSectionParser
<<<zfsget>>> / Transition HostSectionParser -> HostSectionParser
<<<zfs_arc_cache>>> / Transition HostSectionParser -> HostSectionParser
<<<mounts>>> / Transition HostSectionParser -> HostSectionParser
<<<ps>>> / Transition HostSectionParser -> HostSectionParser
<<<cpu>>> / Transition HostSectionParser -> HostSectionParser
<<<uptime>>> / Transition HostSectionParser -> HostSectionParser
<<<freebsd_geom_mirrors>>> / Transition HostSectionParser -> HostSectionParser
<<<kernel>>> / Transition HostSectionParser -> HostSectionParser
<<<netctr>>> / Transition HostSectionParser -> HostSectionParser
<<<ntp>>> / Transition HostSectionParser -> HostSectionParser
<<<tcp_conn_stats>>> / Transition HostSectionParser -> HostSectionParser
<<<zpool_status>>> / Transition HostSectionParser -> HostSectionParser
<<<netstat>>> / Transition HostSectionParser -> HostSectionParser
HostKey(hostname='myhostname', source_type=<SourceType.HOST: 1>) -> Add sections: ['check_mk', 'checkmk_agent_plugins_lnx', 'cpu', 'df', 'freebsd_geom_mirrors', 'kernel', 'mounts', 'netctr', 'netstat', 'ntp', 'ps', 'tcp_conn_stats', 'uptime', 'zfs_arc_cache', 'zfsget', 'zpool_status']
HostKey(hostname='myhostname', source_type=<SourceType.HOST: 1>) -> Add sections: []
Received no piggyback data
CPU load 15 min load: 0.42, 15 min load per core: 0.21 (2 cores)
CPU utilization Total CPU: 3.41%
Check_MK Agent Version: 2.2.0p24, OS: freebsd, Agent plug-ins: 1, Local checks: 0
Filesystem / Used: 83.50% - 49.5 GB of 59.3 GB (warn/crit at 80.00%/90.00% used)(!), trend per 1 day 0 hours: +659 MB, trend per 1 day 0 hours: +1.11%, Time left until disk full: 14 days 20 hours
Kernel Performance Process Creations: 2.71/s, Context Switches: 1925.29/s
Mount options of / Mount options exactly as expected
NTP Time Found 4 peers, but none is suitable, Time since last sync: 3 hours 36 minutes (warn/crit at 5 minutes 0 seconds/1 hour 0 minutes)(!!)
Number of threads 76
TCP Connections Established: 240
Uptime Up since 2024-05-07 08:33:38, Uptime: 21 days 5 hours
No piggyback files for 'myhostname'. Skip processing.
No piggyback files for 'xxx.xxx.xxx.xxx'. Skip processing.
[cpu_tracking] Stop [7f76cffad820 - Snapshot(process=posix.times_result(user=0.020000000000000018, system=0.009999999999999995, children_user=0.0, children_system=0.0, elapsed=0.010000001639127731))]
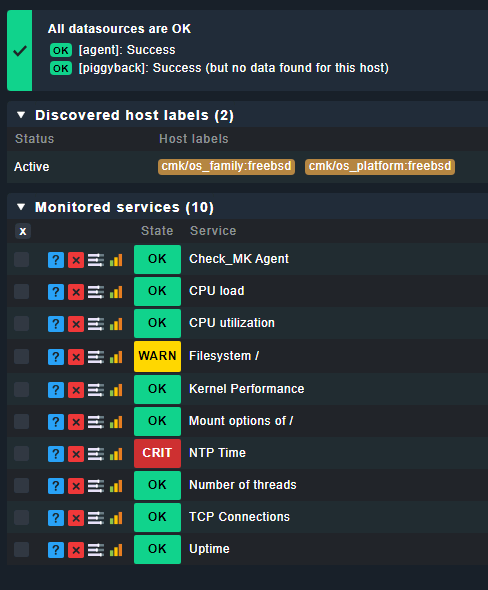
[agent] Success, [piggyback] Success (but no data found for this host), execution time 0.1 sec | execution_time=0.110 user_time=0.020 system_time=0.010 children_user_time=0.000 children_system_time=0.000 cmk_time_agent=0.100
** (If it is a problem with checks or plugins)
Regards.