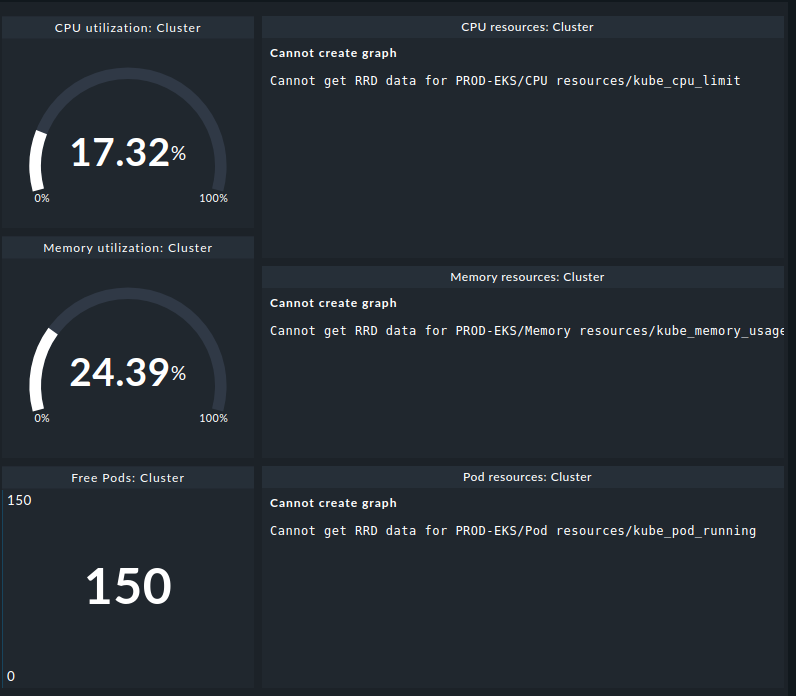
Cannot get RRD data for PROD-EKS/CPU resources/kube_cpu_request**
We start to monitor two kubernetes cluster (AWS EKS v1.27) they are configure the same.
on first cluster the kubernetes dashboard is correclty
on the second one the kubernetes dashboard missing resources(CPU resources: Cluster, MEM resources: Cluster, POD resources: Cluster)
If that’s the case, you should look a bit deeper to find the issues. Check if the metrics arrive at the Checkmk special agent. If they are missing, you should take a look at the metric creation.
the good news: the collection of the data works (as can be seen by the dashlet CPU utilization). So nothing is wrong on the side of the collectors runnig in K8s or how you set up the configuration.
the bad news: the problem is inside your Checkmk site and thus requires more info for troubleshooting. It’s a bit weird, since the dashlets (CPU/Memory utilization: Cluster) and the dashlets (CPU/Memory resources: Cluster) essentially access the same data.
Please take a look at the ~/var/log/web.log and also the rrd files ~/var/check_mk/rrd (do they exist? are they under the right user?).
I can only say the same as @martin.hirschvogel it looks like only a RRD problem. @alexmoo what version of CMK do you use? Raw or Enterprise and if Enterprise with classic PNP4Nagios RRDs or new CMC RRDs?
In booth cases please check if the rrdcached is running correctly.
If you use the Enterprise with CMC RRDs you can have a look at the core log for some clues whats the problem. If using RAW or old RRDs with enterprise you need to look inside the PNP4Nagios logs.
I think this is not weird, the dashlet fetches the current value directly from the perfdata output of the check (this is existing) what it cannot do is showing the value distribution over the time X. This would be fetched from the RRD.
We are using Enterprise and CORE: cmc
the cmc.log is full with errors:
main ones:
2024-03-14 00:07:18 [4] [rrdcached] [rrdcached at "/omd/sites/site1/tmp/run/rrdcached.sock"] [log] -1 No such file: /opt/omd/sites/site1/var/pnp4nagios/perfdata/deployment_prod-eks_datacenter-production_datacenter-production/Memory_resources_kube_memory_usage.rrd
2024-03-14 00:07:18 [4] [rrdcached] [rrdcached at "/omd/sites/site1/tmp/run/rrdcached.sock"] [log] -1 No such file: /opt/omd/sites/site1/var/pnp4nagios/perfdata/deployment_prod-eks_datacenter-production_datacenter-production/Replicas_kube_updated_replicas.rrd
2024-03-14 00:07:18 [4] [rrdcached] [rrdcached at "/omd/sites/site1/tmp/run/rrdcached.sock"] [log] -1 No such file: /opt/omd/sites/site1/var/pnp4nagios/perfdata/deployment_prod-eks_datacenter-production_datacenter-production/Check_MK_execution_time.rrd
2024-03-14 00:07:18 [4] [rrdcached] [rrdcached at "/omd/sites/site1/tmp/run/rrdcached.sock"] [log] -1 No such file: /opt/omd/sites/site1/var/pnp4nagios/perfdata/deployment_prod-eks_datacenter-production_datacenter-production/Check_MK_children_system_time.rrd
2024-03-14 00:07:19 [4] [main] [RRD helper 1679958] [log] Error creating RRD for pnp_multiple;pod_prod-eks_metabase-production_metabase-production-5bf9d46679-gxs6m;Restarts;kube_pod_restart_rate;0: Tried to create /opt/omd/sites/site1/var/pnp4nagios/perfdata/pod_prod-eks_metabase-production_metabase-production-5bf9d46679-gxs6m/Restarts_kube_pod_restart_rate.rrd, but this RRD exists.
and
/var/pnp4nagios/perfdata/node_prod-eks_ip-172-16-40-100.eu-west-1.compute.internal/Memory_nfs_unstable.rrd
2024-03-14 00:00:14 [4] [rrdcached] [rrdcached at "/omd/sites/site1/tmp/run/rrdcached.sock"] [log] -1 No such file: /opt/omd/sites/site1
/var/pnp4nagios/perfdata/node_prod-eks_ip-172-16-40-100.eu-west-1.compute.internal/Memory_pending.rrd
2024-03-14 00:00:14 [4] [rrdcached] [rrdcached at "/omd/sites/site1/tmp/run/rrdcached.sock"] [log] -1 No such file: /opt/omd/sites/site1
/var/pnp4nagios/per
also the files here ‘/omd/sites/site1/tmp/run/rrdcached.sock"] [log] -1 No such file: /opt/omd/sites/site1/var/pnp4nagios/perfdata/deployment_prod-eks_datacenter-production_datacenter-production/’ are xml not rdd
In your system the rrd data is not migrated to the cmc core completely. The error message refer to old PNP4Nagios data.
At the following link you can find e informational for migrating your data.
we converted data to rdd with partly improvement
pods .rrd data is written to
sites/site1/var/check_mk/rrd and only it display correctly.
all other data(deployment, namespaces, etc) are missing
and are still insist to save date to /pnp4nagios/perfdata/
2024-03-15 09:43:22 [4] [rrdcached] [rrdcached at "/omd/sites/site1/tmp/run/rrdcached.sock"] [log] -1 No such file: /opt/omd/sites/site1/var/pnp4nagios/perfdata/namespace_prod-eks_server1-api-production/Check_MK_children_system_time.rrd
2024-03-15 09:43:22 [4] [rrdcached] [rrdcached at "/omd/sites/site1/tmp/run/rrdcached.sock"] [log] -1 No such file: /opt/omd/sites/site1/var/pnp4nagios/perfdata/namespace_prod-eks_server1-api-production/Check_MK_cmk_time_agent.rrd
2024-03-15 09:43:22 [4] [main] [RRD helper 222423] [log] Error creating RRD for pnp_multiple;namespace_prod-eks_server1-api-production;CPU resources;kube_cpu_usage;0.002718: Tried to create /opt/omd/sites/site1/var/pnp4nagios/perfdata/namespace_prod-eks_server1-api-production/CPU_resources_kube_cpu_usage.rrd, but this RRD exists.
it’s all very strange because the first cluster just work out ok
any idea?