CMK version: Checkmk Free Edition 2.1.0p28
I installed cluster collector from helm.
Part about NodePort in values is:
service:
    # if required specify "NodePort" here to expose the cluster-collector via the "nodePort" specified below
    type: NodePort
    port: 8080
    nodePort: 30035
    annotations: {}
Kubernetes is managed by Rancher, version Provider: RKE2
Kubernetes Version: v1.22.11.
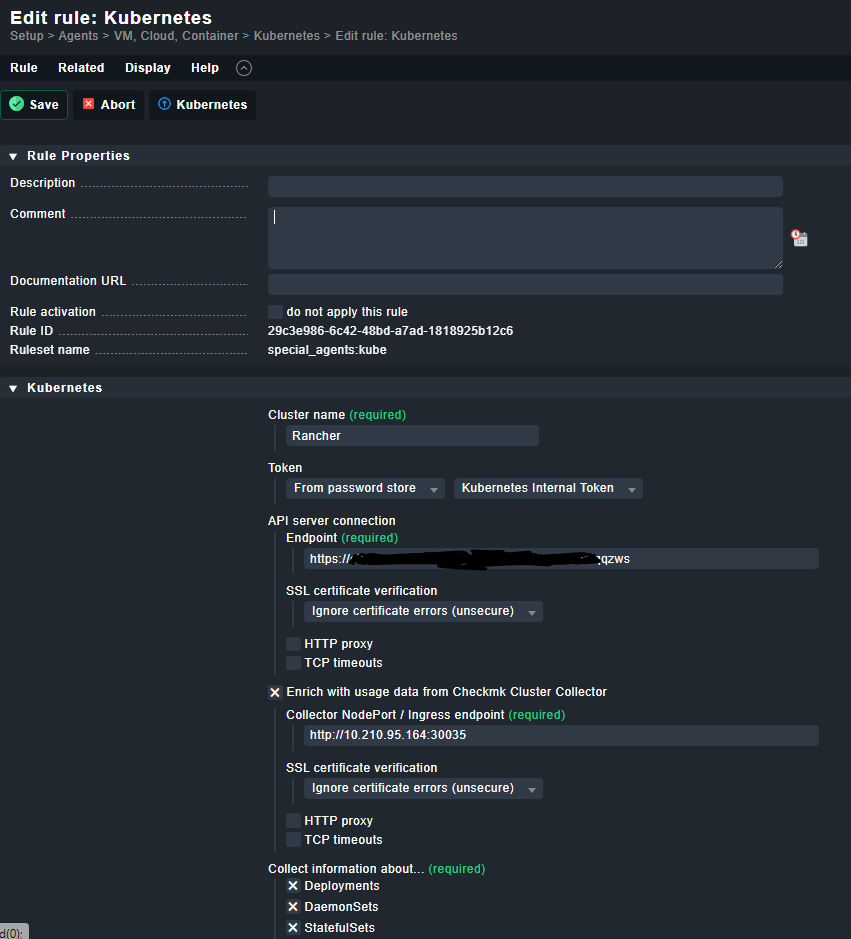
I have configured:
API Address for server is server name from command (server name). It is the same name as in KubeConfig downloaded from GUI in Rancher.
kubectl config view
Access token was generated on Rancher side with all scope (it is not the same as token generated during installing collector with using helm). With token generated during creation by helm - connection to cluster doesn’t work.
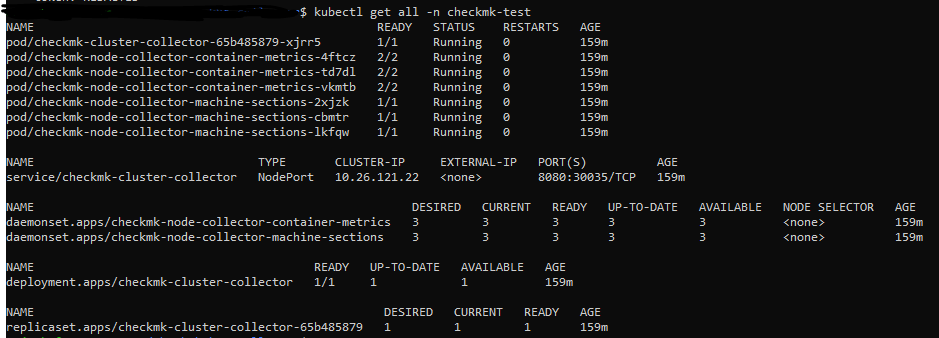
When I check services, I have:
export TOKEN=$(kubectl get secret $(kubectl get serviceaccount checkmk-checkmk -o=jsonpath='{.secrets[*].name}' -n checkmk-test) -n checkmk-test -o=jsonpath='{
.data.token}' | base64 --decode);
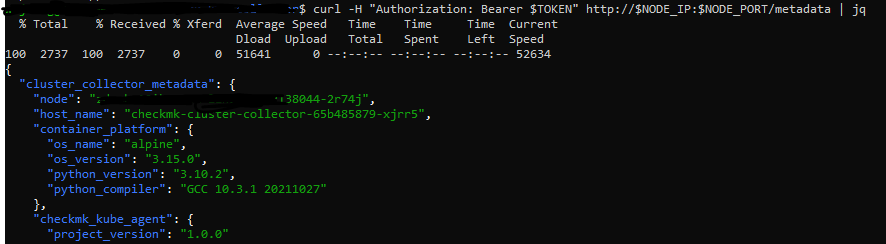
curl -H "Authorization: Bearer $TOKEN" http://10.210.95.164:30035/metadata |jq
% Total % Received % Xferd Average Speed Time Time Time Current
Dload Upload Total Spent Left Speed
100 2737 100 2737 0 0 53666 0 --:--:-- --:--:-- --:--:-- 54740
{
"cluster_collector_metadata": {
"node": "xxxxx",
"host_name": "checkmk-cluster-collector-65b485879-xjrr5",
"container_platform": {
"os_name": "alpine",
"os_version": "3.15.0",
I added token from Rancher, not from checkmk collector service.
When I added from checkmk collector service, I don’t have connection to cluster managed by Rancher.
I added name or internal ip address from node and password from service generated by checkmk helm. I tried with http/https and port 443 on the end but without any result.
Maybe I did something wrong?
The internal IP can only be reached internally, and not via an external service.
a) API server connection you get via your kubeconfig (use the control plane nodes tough)
b) Most reliable for any internal service (here: cluster collector) to be reached by the outside is an ingress in Kubernetes. Create one and use that one.
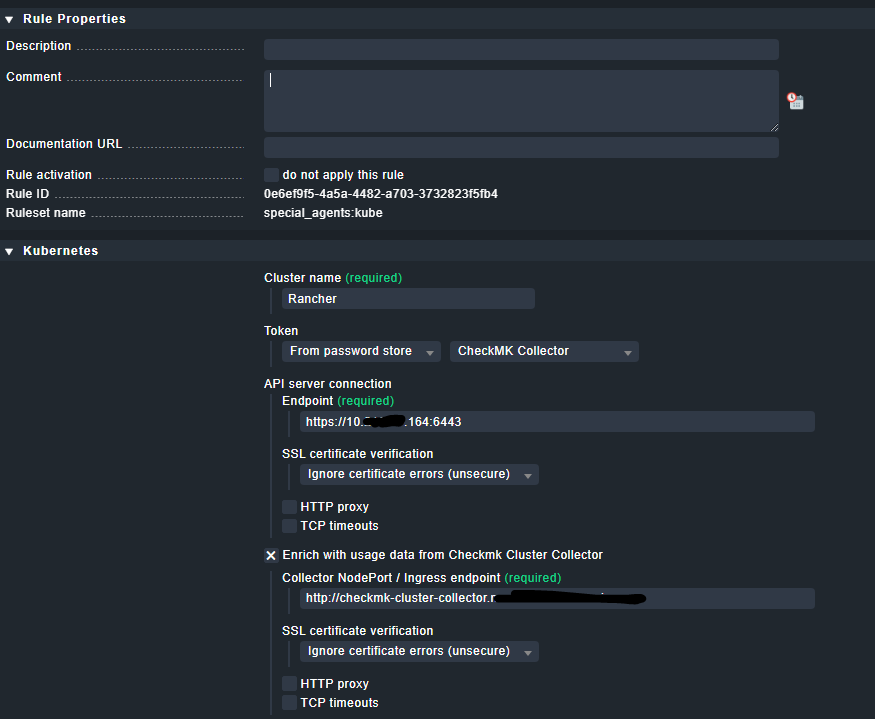
I created ingress for checkmk-collector. It is reached by dns name in browser and in browser I have {“detail”:“Not authenticated”}. What I need to add in field API server connection? I added API server from kubeconfig, internal ip of node, ingress endpoint but in each case I have cluster collector Status: Connection Error (Failed attempting to communicate with cluster collector at URL. I added password from token from checkmk service.
This topic was automatically closed 365 days after the last reply. New replies are no longer allowed. Contact an admin if you think this should be re-opened.