Any entry inside the core log for the rrd creation?
It would be a point to set the log level for rrd processing to an higher value to get some error messages.
Global settings → Logging of the core → RRD processing
Great idea, thanks. Why haven’t I thought of that? Dang! ![]() Will do & see what comes up in the log.
Will do & see what comes up in the log.
Hmmm interesting. After each restart I see the following:
2024-05-27 16:34:06 [5] [rrdcached] [rrdcached at "/omd/sites/linet/tmp/run/rrdcached.sock"] successfully connected
2024-05-27 16:34:07 [6] [main] [RRD helper 2787746] creating new RRD file for service "keycloak4.test.…cut…;Keycloak metrics localhost:8080", command: cmc_single;keycloak4.test.…cut…;Keycloak metrics localhost>
2024-05-27 16:34:57 [3] [main] [RRD helper 2787746] too many bytes without newline, clearing buffer.
2024-05-27 16:34:57 [3] [main] [RRD helper 2787746] too many bytes without newline, clearing buffer.
2024-05-27 16:34:57 [4] [main] [RRD helper 2787746] [log] ry_used_allocator_type_pooled_byte_buf_allocator_id_242596583_memory_type_direct;netty_allocator_memory_used_allocator_type_unpooled_byte_buf_allocator_id_2079515765_memory_type_dir>
I’ve cut off the lines here; they’re really very, very long.
What this is, is a local-type custom check that reads Keycloak metrics & outputs them all (!). What seems to happen here is that all of them are handed over to the RRD processing in one go. The RRD processing most likely has some checks in place in order to defend against arbitrarily long line attacks, cuts the processing there in the middle, then processes the rest of the overly long line (which is then obviously invalid).
We have several of those. I’ll try disabling all of them & see if that calms the process down.
Additionally there are roughly 160 of these messages per second in the log:
2024-05-27 16:47:37 [7] [main] [rrdcached at "/omd/sites/linet/tmp/run/rrdcached.sock"] pushing update
Hmmmm: ![]()
This cannot be good for RRD creation processes ![]()
I’ll definitely delete all of those metrics & adjust my local-type check to only emit values for metrics I’m actually interested in instead of for all metrics that Keycloak itself outputs.
I think you found the source for the RRD creation problem.
It is possible that before these huge metrics where silently ignored^^
2 Likes
That seems very likely, yes. Thanks again for the tip wrt. the RRD log level; that definitely helped.
Now we’ll have to wait & see if that also improves the general load on the system as well as the intermittent outages in graph creation.
1 Like
Out of curiosity, can you recall how many metrics were created by this single local check?
This is not the first error of this kind and I wonder if we shouldn’t simply build in a fairly high limit to protect the core and the subsequent processing chain.
1 Like
I’m not entirely sure, to be quite honest.
I can tell you the number of services that were present when the “line too long” thingy mentioned above happend, though: roughly 180 metrics, which amounted to roughly 12 KB of metrics description.
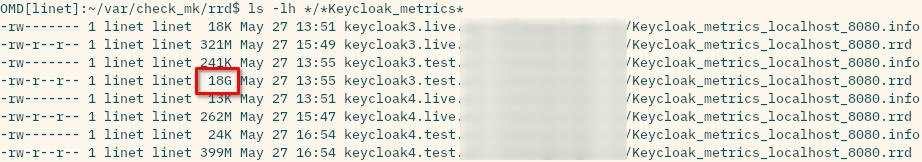
The reason why I’m unsure about the number of services that resulted in the 18 GB file is that I think I remember that during development of this custom check I ran into some issues & had to change the naming format of the metrics multiple times. As we know, metrics for which no values are sent aren’t removed from the RRD anymore. Therefore it’s quite possible that the RRD contained a lot of metrics whose names were used only temporarily.
If you’re curious, this is a check for the Keycloak server’s “metrics” endpoint. Its output looks something like this:
[0 root@keycloak3 ~] curl -s http://localhost:8080/metrics | head
# TYPE base_thread_count gauge
# HELP base_thread_count Displays the current thread count.
base_thread_count 54.0
# TYPE base_memory_usedNonHeap_bytes gauge
# HELP base_memory_usedNonHeap_bytes Displays the amount of used memory.
base_memory_usedNonHeap_bytes 2.65830728E8
# TYPE jvm_memory_used_bytes gauge
# HELP jvm_memory_used_bytes The amount of used memory
jvm_memory_used_bytes{area="nonheap",id="CodeHeap 'profiled nmethods'"} 4.6024192E7
jvm_memory_used_bytes{area="heap",id="PS Old Gen"} 1.52194472E8
I discarded the comments, re-formatted the names so that they only contain letters, digits & underscores.
As a final note here: the issue with the cmk --create-rrd process ballooning in size has been solved. It was indeed due to the 18 GB RRD file I had lying around. I’ve reduced the total amount of RAM down to 24 GB (from 48 GB to which I had to bump it a couple of weeks ago due to said process). There are no more outages in graphing anymore either.
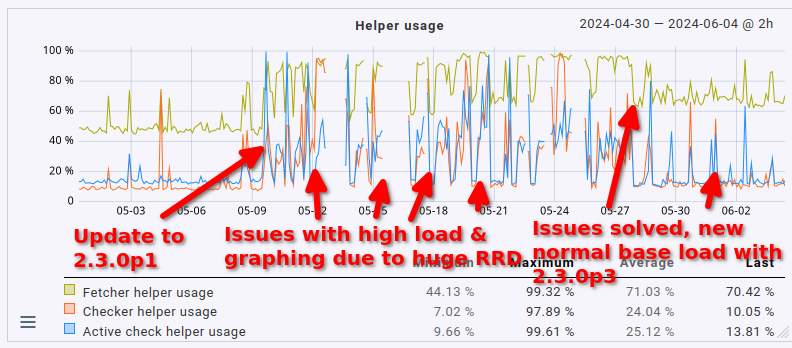
This fix slightly reduced the overall load on the server as well by 1 CPU core (no big surprise here, it was using 1 CPU core constantly before). What’s definitely nice is that the fetcher usage also dropped from > 90% to around 60 to 70% (that’s roughly where it sat before the update, too, just slightly higher). That being said, the load avergage/CPU usage helper user is still roughly twice as high as it was before the update (CPU load around 8 to 9, up from 3 to 4; CPU usage around 60%, up from 35%).
So yeah. The system works well now, but anyone upgrading to 2.3.0 with a moderately sized instance may want to plan for much higher resource utilization, not just a measly 20%. Expect double the amount at least.
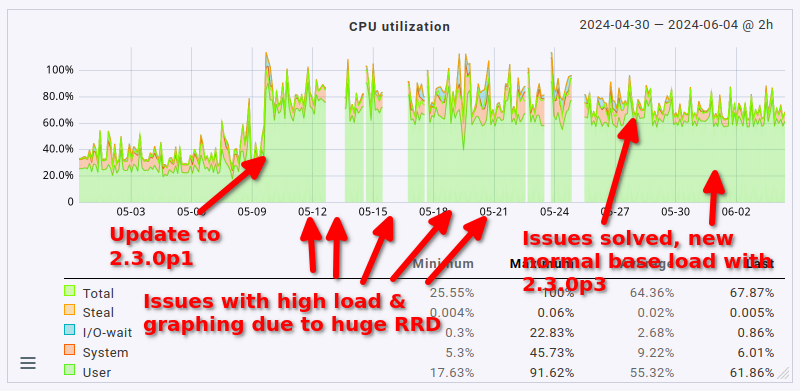
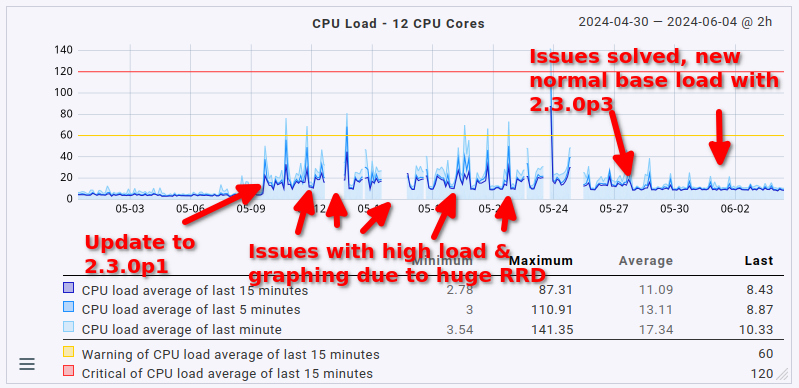
Lastly, in case anyone is interested in how this presents in graph form, maybe for comparing it to their own situation: here’s the CPU load average, CPU usage & fetcher usage over the last 35 days.
1 Like
Thanks Moritz.
Please use the average calculation, not the maximum calculation in the RRDs by clicking on average here
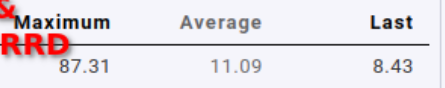
This gives a better picture for that analysis. And I would be interested to see the values in that case.
In most systems we have actually seen the 10-15% increase - yours is the largest I have seen so far. It might indicate that there is another issue - or your system is at the tipping point, where thinks start to ‘aufschaukeln’ (not impossible given a CPU load of 11-13 at 12 cores)
1 Like
No problem. Here are the same three graphs with average aggregation. I’ve not labeled them, it should be easy enough to map the labels from my earlier graphs to the average ones.
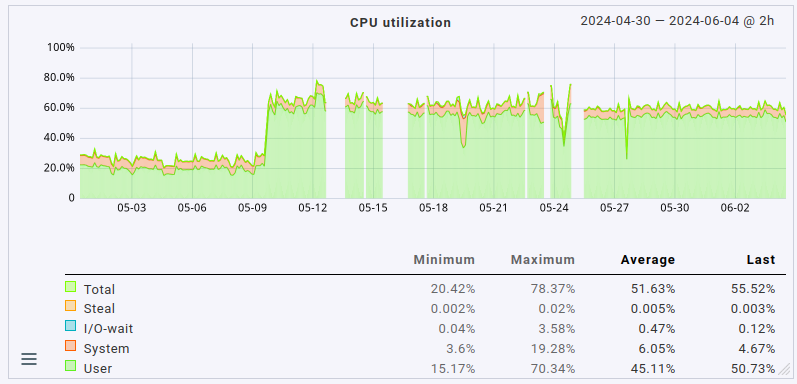
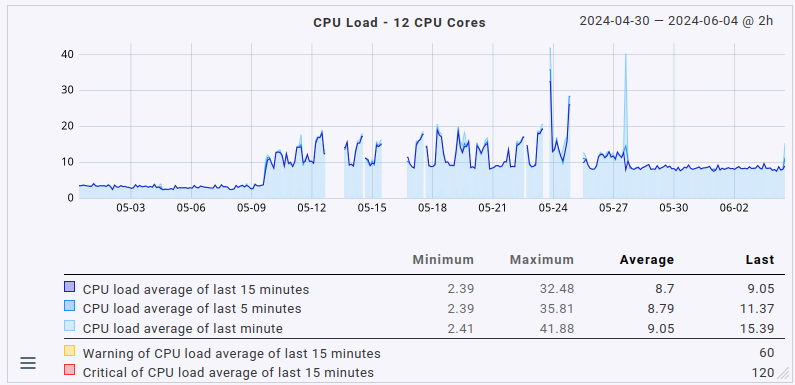
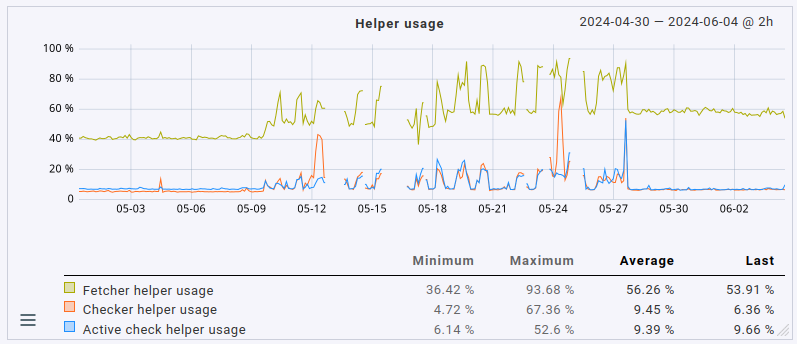
Summarizing the changes in averages:
- CPU load up from slightly below 4 to 8.5
- CPU usage up from 25% to 60%
- fetcher helper usage up from slightly above 40% to around 60%
Please note that the total number of monitored hosts & services has actually gone down slightly as I’ve moved several hosts to a different site in the early, problematic days of running 2.3.0p1.cee:
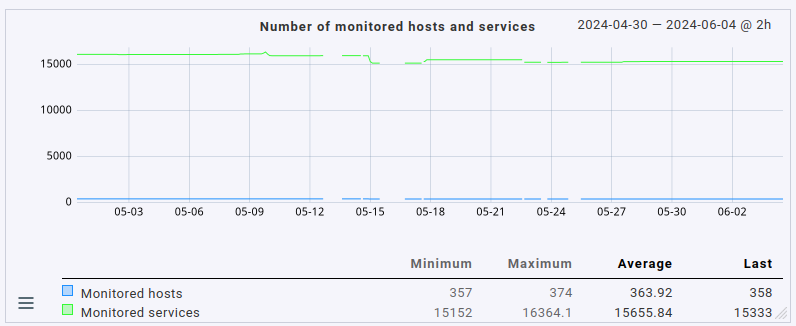
If they’d still be monitored on this site, I’d expect an even higher load (albeit only very slightly higher as the number of hosts/services moved isn’t that high).
I can only say there must be some other problem on this system.
All the 2.3 i had updated until now only had a around the 10% increase @martin.hirschvogel mentioned.
In your system this should result in a CPU usage around 25-30%.
I would pay a little bit more attention to the own extensions you use in your system as these where the source of all the found problems until now.
If the system is not only a worker node that does the heavy lifting for checking, but also a web frontend, then i would assume that most of the extra CPU resources is consumed by the Apache.
Higher helper usage you should only have if the check time for the single CheckMK services are higher than before.
3 Likes
Hello,
Many thanks for this useful hint. We are on the way to upgrade to 2.2 and from there quickly to 2.3 and I am very interested to see how the software performs.
Just please allow me one recommendation:
Instead of using ‘static’ configuration I would recommend to use regular expressions like:
python3 /omd/sites/master/bin/cmk .*?--checker
Otherwise if you change logging e.g. to ‘informational’ the process could not be found anymore because command line looks different:
python3 /omd/sites/master/bin/cmk -v --checker
Nevertheless command line looks different for different process and needs different regex.
1 Like
This topic was automatically closed 365 days after the last reply. New replies are no longer allowed. Contact an admin if you think this should be re-opened.