After updating to 2.3.0 we’re dealing with much higher load on your CheckMK central site. I have read the upgrading instructions which did state that a somewhat higher load was to be expected. Quoting:
he update of the Python interpreter from version 3.11 to 3.12 alone causes a load increase in the single-digit percentage range. Furthermore – depending on the proportion to the total number of checks – more extensive checks, especially in the cloud area, can result in further additional load, so that a total of 10-15 % (in extreme cases around 20 %) more CPU load can be expected.
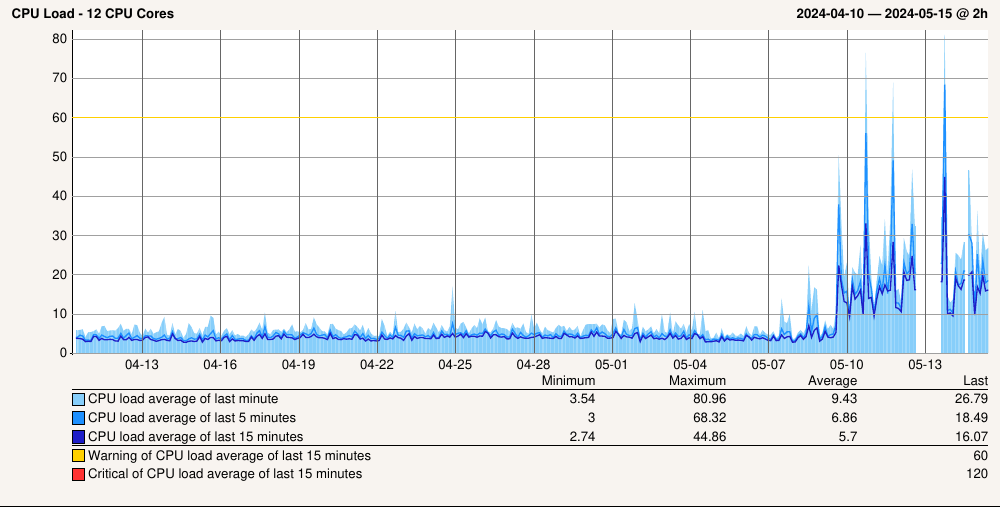
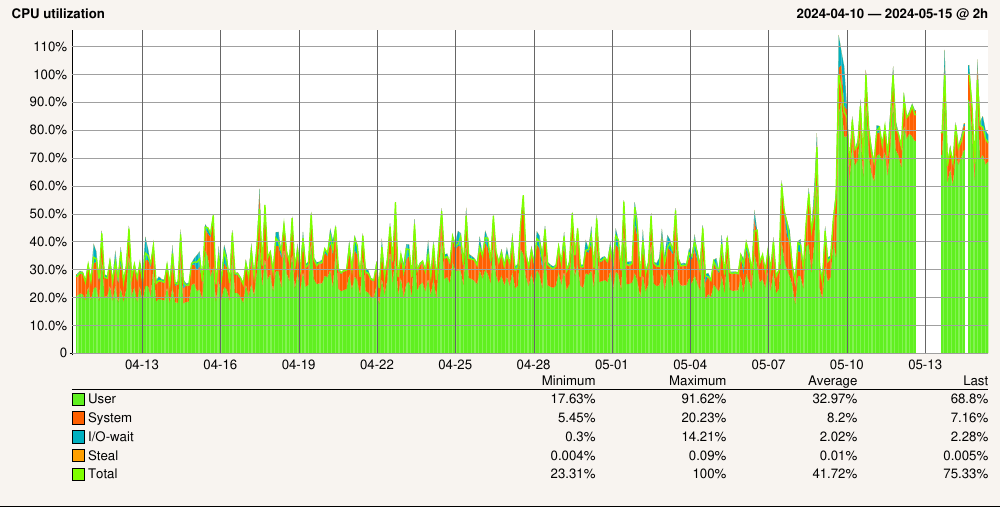
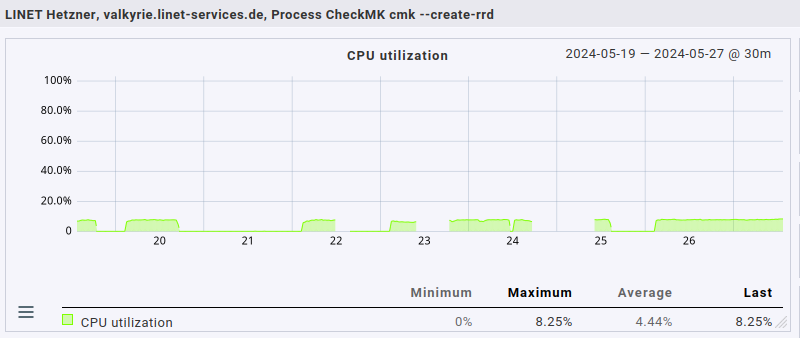
Well, look’s like we’re an extreme extreme case, then. Here are a couple of graphs from our central site:
Sure, I can throw hardware against the problem, I can split out half of the hosts to a new site with the same amount of resources — but that doesn’t explain why the induced load is so much higher than anticipated compared to the upgrade notes. It’s also not quite what I’d like to do, to be honest. Sure, if it’s the only possible solution I’ll go down that route, but…
We have quite a lot of customers, and each of those customers gets its own site (makes sense from the network topology side). In total we monitor roughly 1.400 hosts with 58.000 services; of those 400 hosts & 16.000 services are monitored directly from the central site (the one the graphs above are from). All the other sites range from five to 50 hosts depending on the customer’s network size.
And before someone asks, yes, we’re paying for the MSP edition but still using the Enterprise Edition due to… reasons.
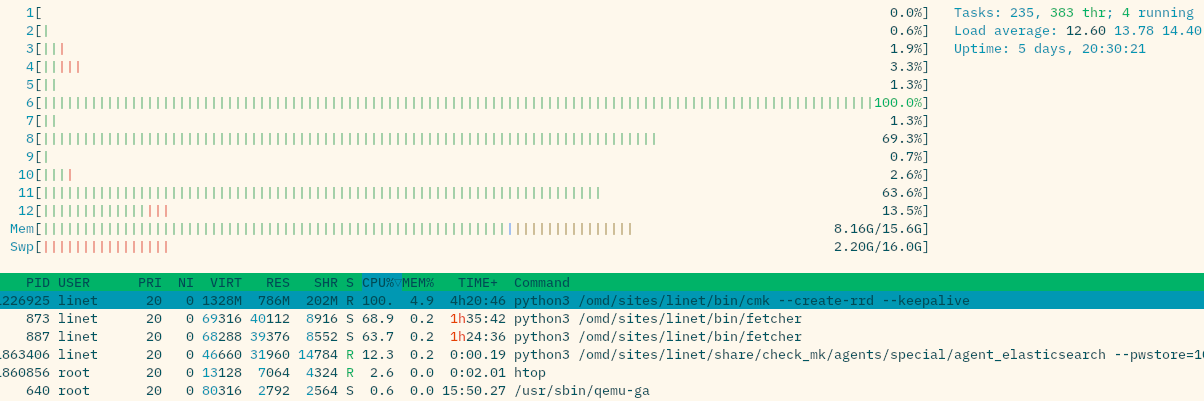
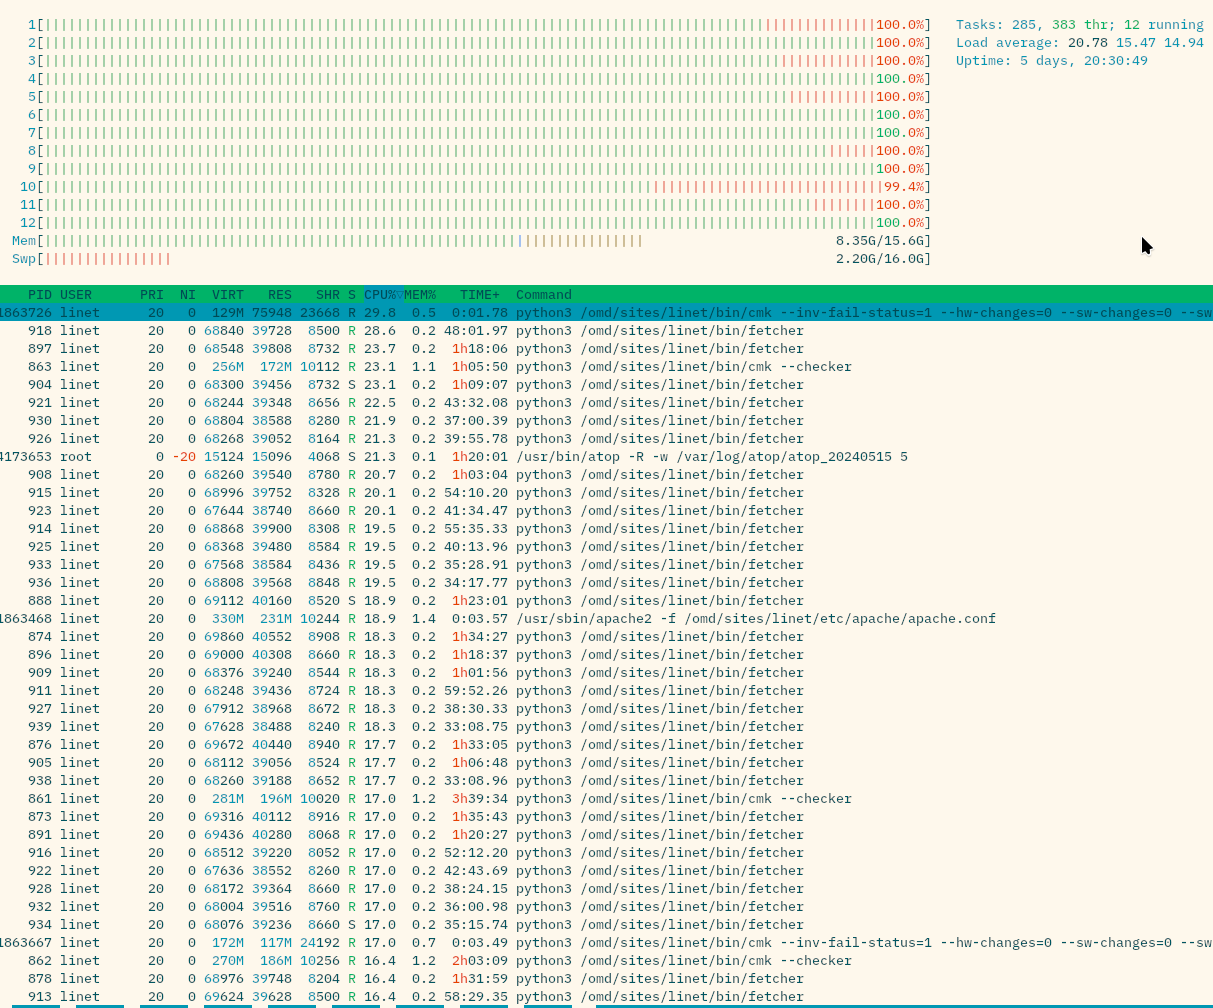
If you take a look at top/htop, what do you see as the processes with such high CPU demand?
At the moment i have here a instance with 1600 agent based hosts - 16 cores - load 2.4 avg - utilization 15%
With 2.2 the demand is evenly spread over all the fetcher processes and a the cmc process.
The “fetcher storm” state lasts several seconds, maybe up to ten or so. The “quiet” state then lasts a lot longer; my guess is “fetcher storm” happens minutely.
BTW, that cmk --create-rrd is always there, always using one CPU core at 100% during the “quiet” phase & proportionally less during “fetcher storm” state.
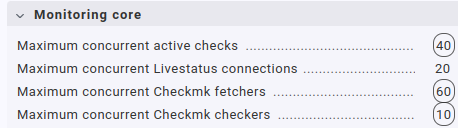
BTW, yes, that’s a huge number of fetcher processes. I do remember having configured such a high number quite a while ago in order to tackle fetcher usage issues, and the high number hadn’t been an issue with 2.2.0pXY. The current settings for this one central site are:
All of the other, much much smaller sites have much more reasonable, lower values; mostly just factory defaults.
I don’t think the fetchers are the real problem here. More important is the “cmk --create-rrd” this can correspond to the RAW edition problem with process_perfdata there.
Booth editions have problems to write all the data to RRDs or to create RRDs.
This doesn’t seem to be a coincidence.
The fetcher “storm” looks like the CMC core has now the bad scheduling inherited from the classic Nagios core
This will help to identify the actual location of the performance problem.
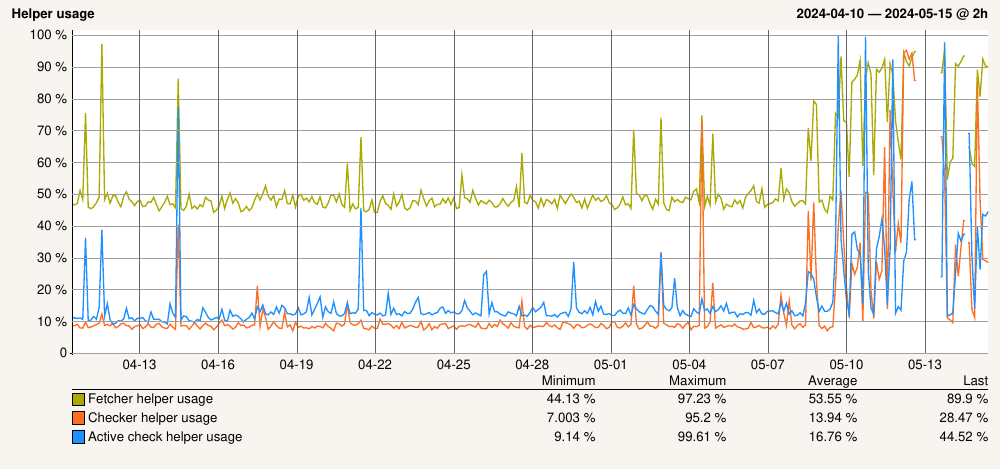
I had a similar issue in the past. My helper usage nearly doubled, but the CPU impact was still quite small, since the base CPU utilization of the helpers was at 5%.
In your setup it seems that the fetchers have quite a lot to compute. Normally the fetchers simply read the data from external data sources (check_mk_agent) or from the special agents. While doing this, they are more or less idle.
The fetchers in your screenshot are computing something.
Might be snmp or impi related computations…
Note: The problem with “cmk --create-rrd” is not related to the fetchers - but it is definitely a problem that we are currently investigating.
Thank you very much, I’ll try to set it up. Unfortunately I cannot add a new rule for enforced services for “State and count of processes” as i get an exception instead of the mask for configuring the new rule:
2024-05-16 15:24:06,762 [40] [cmk.web 437076] MKAutomationException: Error running automation call <tt>get-check-information</tt>, output: <pre>({'adva_fsp_if':
…500 KB of data structure dump removed…
</pre>: invalid syntax (<unknown>, line 1)
Quite likely that this is due to one of the plugins. Unfortunately the error message isn’t too helpful.
Try this. Maybe it helps to identify the file. cmk --debug --automation get-check-information
The task of this automation call is to fetch the data for the enforced services.
Wait, no, I don’t actually use State.OK as the default value… Here’s the ruleset definition from said plugin (imports removed, not yet converted to 2.3.0 APIs):
def _parameter_valuespec_linet_apt():
    return Dictionary(elements=[
        ("normal",
         MonitoringState(
             title=_("State when normal updates are pending"),
             default_value=0,
         )),
        ("security",
         MonitoringState(
             title=_("State when security updates are pending"),
             default_value=0,
         )),
        ("stale_normal",
         MonitoringState(
             title=_("State when stale normal updates are pending"),
             default_value=1,
         )),
        ("stale_security",
         MonitoringState(
             title=_("State when stale security updates are pending"),
             default_value=2,
         )),
        ("stale_age",
         Age(
             title=_("Duration after which an update is considered stale"),
             default_value=24*60*60,
         )),
    ],)

rulespec_registry.register(
    CheckParameterRulespecWithoutItem(
        check_group_name="linet_apt",
        group=RulespecGroupCheckParametersOperatingSystem,
        match_type="dict",
        parameter_valuespec=_parameter_valuespec_linet_apt,
        title=lambda: _("LINET APT Updates"),
    ))
Will have to see how to convert it to something 2.3.0 handles properly.
Got it figured out: I had used State.OK etc. in the default check params in the agent-based check plugin. Converted them to regular integers, and now I can add enforced services just fine.
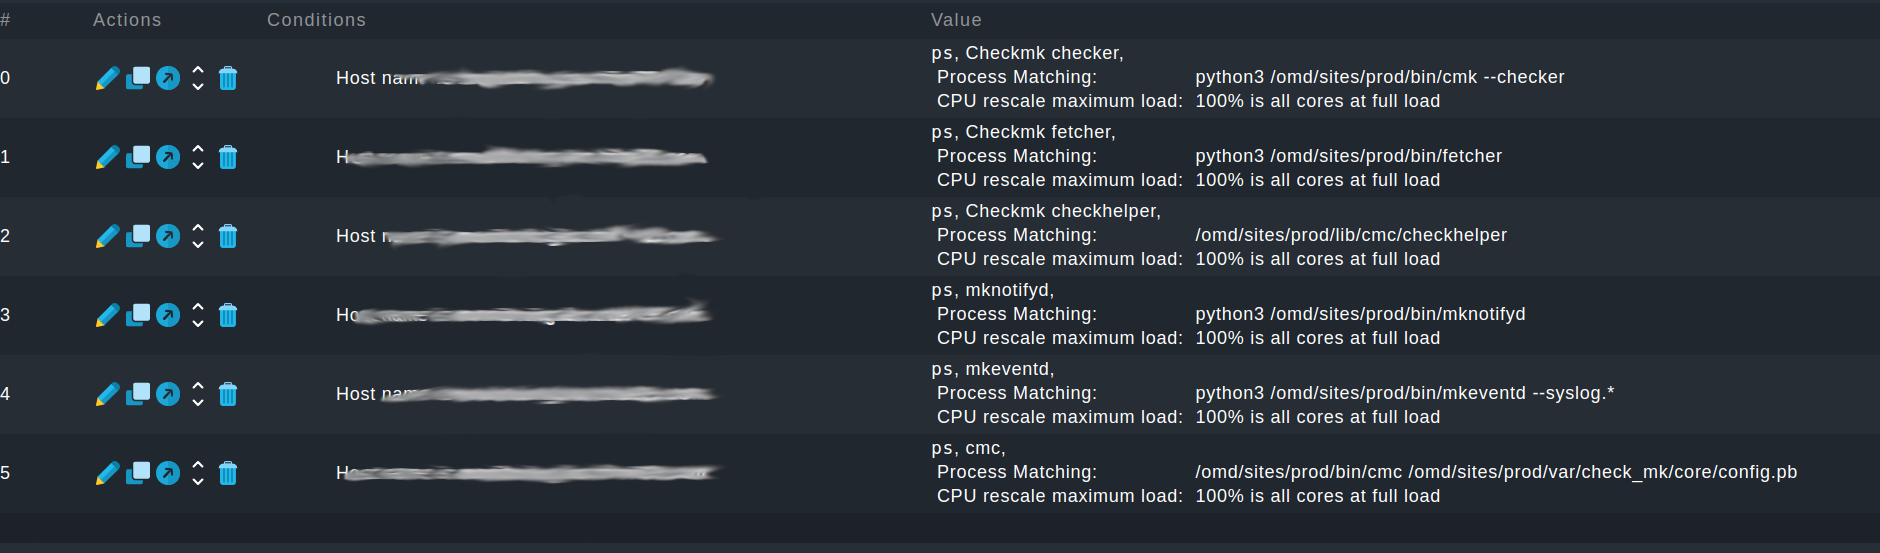
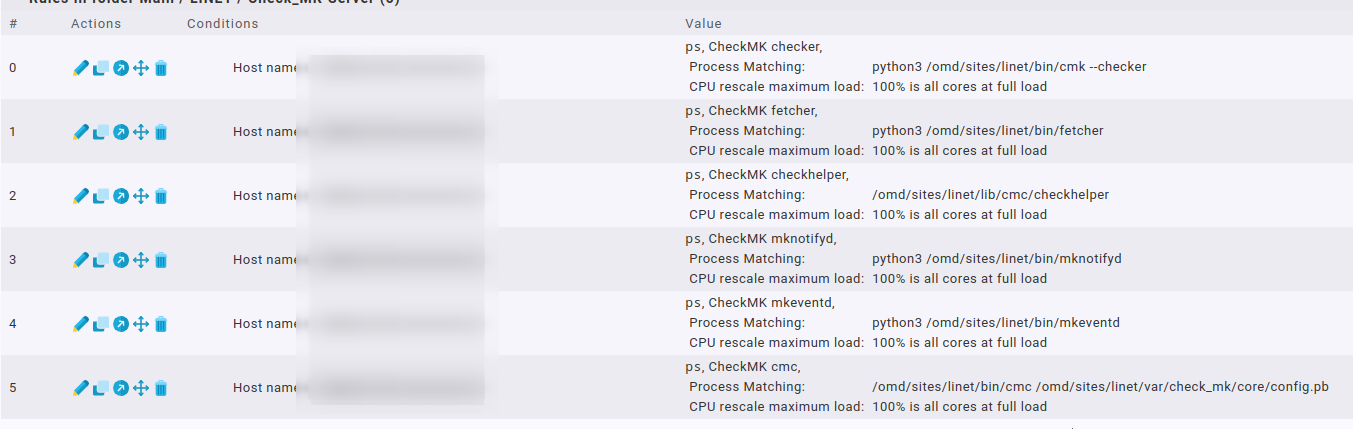
For reference & just to make sure I’ve added the services you wanted, here’s what I created:
I copy-pasted the exact process names directly from the output of ps uaxw.
One thing I noted was that I do not have an mkeventd in the process table that also contains --syslog.*; I only have one without it. I’ve decided to add that one, as can be seen in the screenshot.
Unfortunately the fact that the cmk --create-rrd process uses 100% a lot of the time bites me in the behind here: whenever that happens, and that’s quite often, it seems, graph generation stops completely for that site. I have to omd restart (a omd restart cnc would suffice, I guess, haven’t tried it, though).
Judging from when it stops working & starts going to 100% (one CPU core, looks very much like an endless loop) it seems to be connected to when I activate changes on the site via WATO. I haven’t been able to pinpoint under which circumstances this happens exactly; it definitely doesn’t happen always but often enough to cause real issues due to the gaps in graphing.
Any ideas? I’ve read several other threads here that have issues with graphing after updating to 2.3.0, but most (all?) of them are using the raw edition, which we aren’t, and therefore they don’t apply to me, I think (might be wrong!).
Well, the load’s still as high as before. Adding the forced services hasn’t given my any new insight.
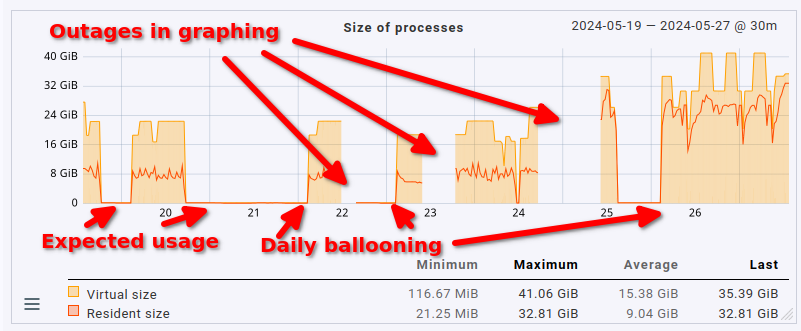
What has changed is that I had to bump RAM from 16 GB under 2.2.0 to now 48 GB due to the cmk --create-rrds process completely going bananas each and every night:
Sometimes activation after changes causes the process to go down to nothing at all, sometimes it causes the reverse. However, each and every night at around 3 AM its memory usage balloons to insane amounts of memory. Currently it’s sitting at over 32 GB of RSS (VSZ is obviously even higher):
On top of this insanely high memory & CPU usage updating the metrics often just stops. No correlation to be found yet. The cmk --create-rrds process is running, it’s still at 100% CPU (= according to htop, meaning one core fully, constalty used), but it just isn’t updating anymore. Always have to omd restart in such a case. Happens multiple times a day, some days doesn’t happen at all.
We don’t have a support contract yet, therefore no support ticket yet either. We’ve scheduled a call to upgrading our contract. The reason is simple: up until 2.3.0 we’ve been able to fix everything ourselves. But the 2.3.0 update is seriously kicking our asses here.