Hi,
I’ve multiple checkmk instances. Free and Enterprise edition, in both versions the same issue.
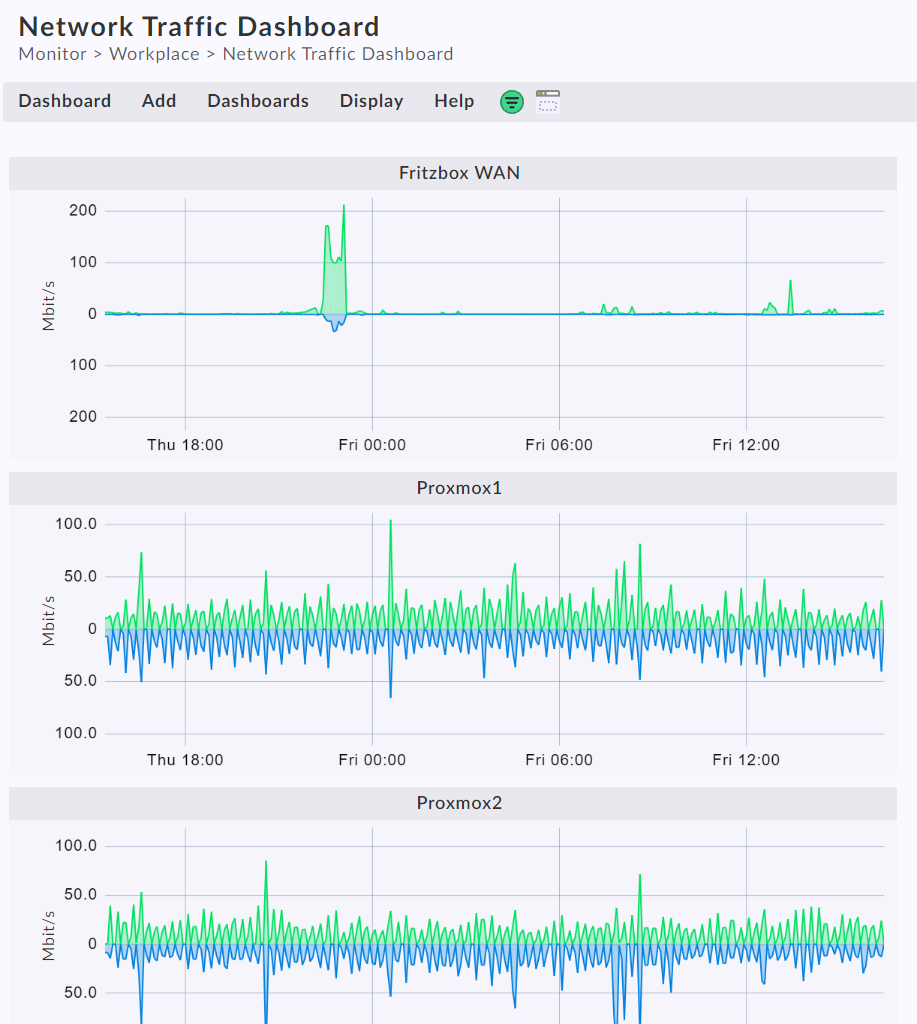
We want to create an dashboard with bandwidth graphs of multiple interfaces.
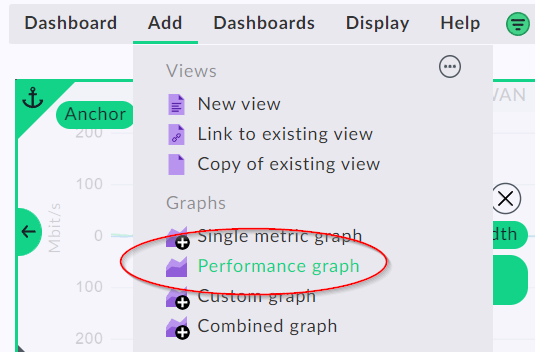
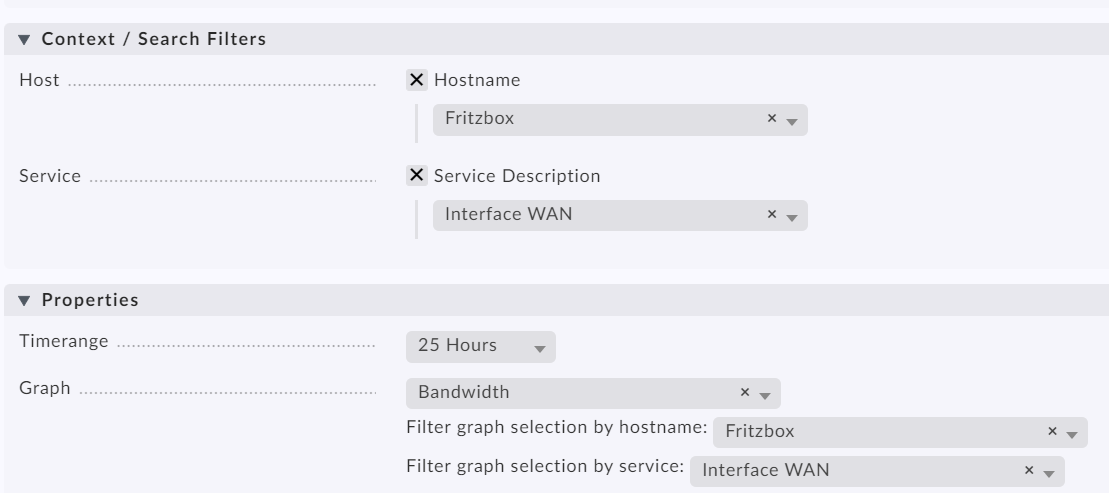
When we choose one of the 4 options for graphs, we select our device and interface, and select total bandwidth.
We receive an error: Metric names must only consist of letters, digits and underscores and they must start with a letter. And the metric ‘total bandwidth’ is gone.
When we leave it blank, we must apply an filter on the dashboard, but then all the items will use that single host for the information.
Anyone suggestions how we may create these graphs?