Happy new year dear Community! ![]()
recently i have been given the task to monitor our sensors that collect humidity and temperature data from our buildings. I created everything including graphs and a report that is supposed to be sent to some higher ups. All good, works as intended - checkmk is great… if there wouldn’t be this tiny little problem:
I can’t seem to change the units to what they are supposed to be.
Example:
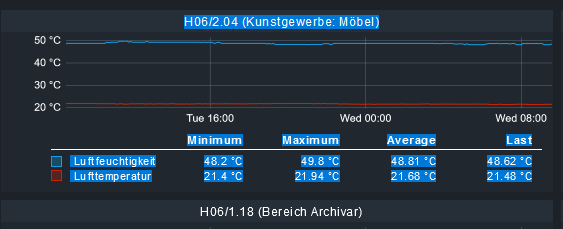
If you look at this picture, you can see that the temperature and the humidity are displayed correctly, but both are in °C
Luftfeuchtigkeit (Blue)= Humidity , Lufttemperatur (red) = Temperature)
i tried to change this in the Graph settings but can’t seem to find a way to change single lines of the sensor. The Sensors have up to 4 single metrics (2x temp / 2x humidity / can differ) but i can only change everything that i get from the whole sensor to % or °C etc.
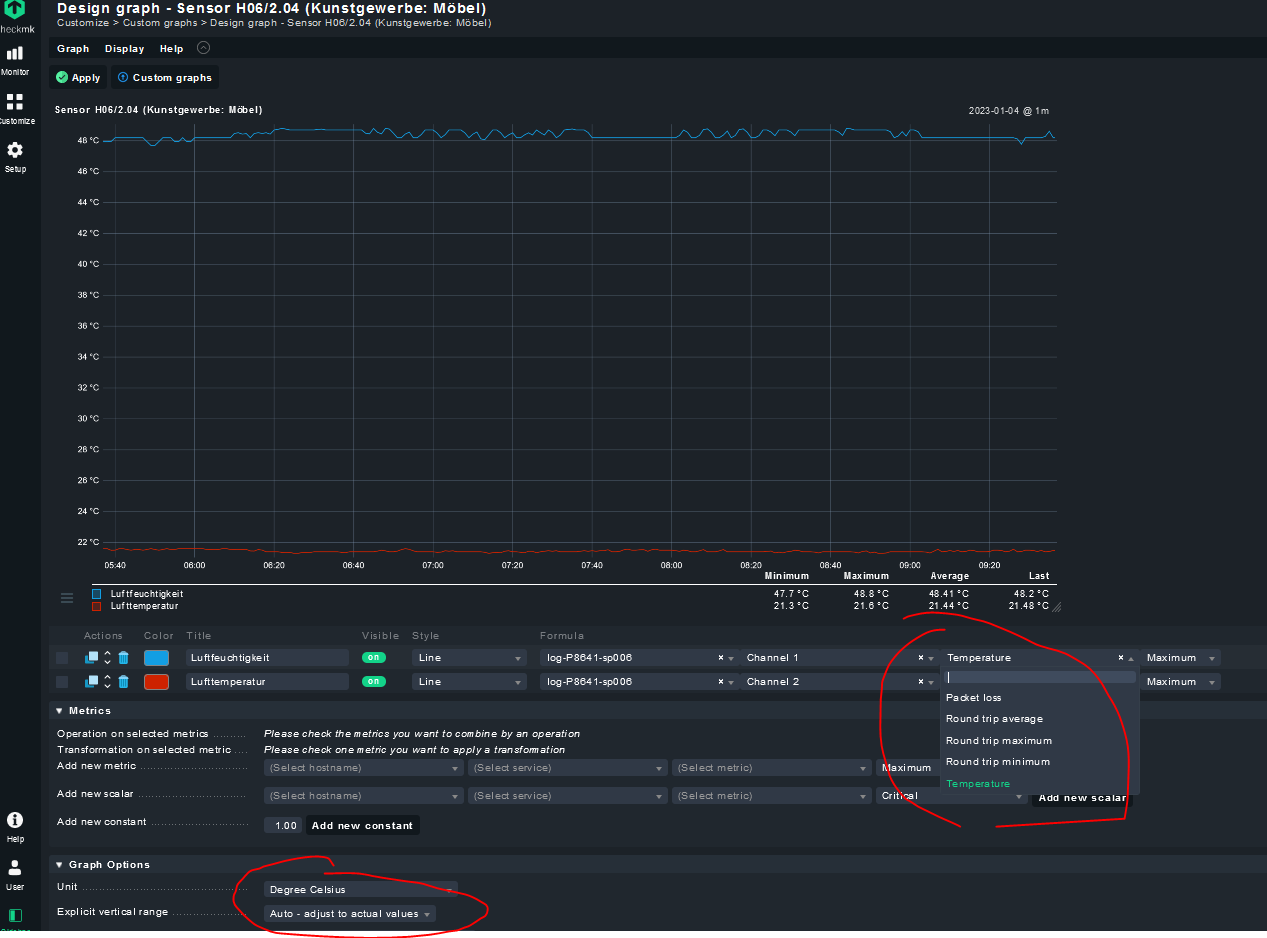
I also tried separate both values into two different graphs (one for % and one for °C) and combined them → same result. Only °C or %, not both.
Can a wise member of the community maybe enlighten me?
I’ve tried to find anything about this but probably didn’t catch it.
Maybe there is a way to add an additional Y axis
Thanks a bunch!
Checkmk Version 2.0.0p18