Hi
I have this output of a mrpe Check:
OK: |Room1=14.5|Room2=14.5
But It does onyl show one room in the graph.
How must the output be that both values are in the same graph (Community Edition)
Hi
I have this output of a mrpe Check:
OK: |Room1=14.5|Room2=14.5
But It does onyl show one room in the graph.
How must the output be that both values are in the same graph (Community Edition)
The first question is. Do the two metrics show up inside the MRPE check?
As example
If yes then you need to have a graph definition for this check that puts booth inside a single graph.
The graph definition use the service check command and the different performance data names to build a graph.
Something like this. It’s only an example ![]()
graph_info['cisco_wlc.ap_uptime'] = {
    'title': _('AP/LWAP Uptime'),
    'metrics': [
        ('cisco_wlc_lwap_uptime_seconds', '-area'),
        ('cisco_wlc_uptime_seconds', 'area'),
    ],
    'optional_metrics': ['cisco_wlc_lwap_uptime_seconds'],
}
Yes I have two metrics
But where do I have to define that graph definition?
The file with the graph definition is put inside “~/local/share/check_mk/web/plugins/metrics/”
To write such a definition you need the “service check command”
Example
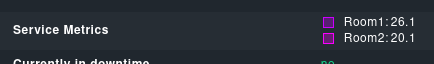
![]()
And booth the real names of your performance values.
Example
The “metric_info” are to format the single performance values with name and color.
The “graph_info” are for designing the graphs you want to see.
Oh ok. I see not that easy, also have to put that in the docker container of checkmk…
Thanks I will check that!