after a long time i’m writing a new agent based check for NVMe multipath over FC (like the old multipath check). Following Agentenbasierte Check-Plugins entwickeln i’ve created some metrics in my check function:
$ cmk -vpn <host>
...
NVMe multipath NetApp ONTAP Controller Number of paths: 8, Number of paths in state live: 8 (count_nvme_paths=8;;;0; count_nvme_paths_live=8;;;0; count_nvme_paths_new=0;;;; count_nvme_paths_connecting=0;;;; count_nvme_paths_deleting=0;;;; count_nvme_paths_resetting=0;;;; count_nvme_paths_dead=0;;;;)
...
For the first metric “count_nvme_paths” i’ve created a Metric()
from cmk.graphing.v1 import Title
from cmk.graphing.v1.metrics import Color, Graph, MaximumOf, Metric, Unit, DecimalNotation
from cmk.graphing.v1.perfometers import Closed, FocusRange, Perfometer

metric_nvme_subsystems_count_nvme_paths = Metric(
    name = "count_nvme_paths",
    title = Title("Count of NVMe paths"),
    unit = Unit(DecimalNotation("")),
    color = Color.ORANGE,
)
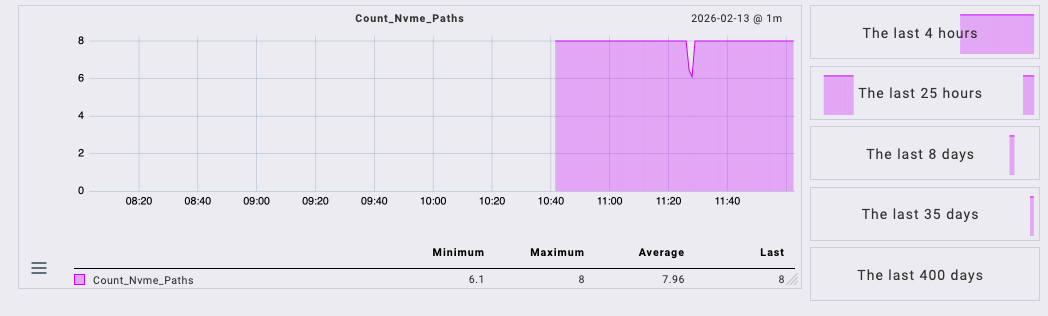
This file is located in ~/local/lib/python3/cmk_addons/plugins/nvme/graphing/graphing_nvme.py. The graph is rendered like this:
Sometimes you need to omd restart apache for changes in the graphing part of checkmk to take effect. Also, you might want to have a look into ~/var/log/web.log.
I think (but am not 100% sure) that the MaximumOf doesn’t really calculate the greatest value of a metric but is just the upper boundary given in this statement:
with some reasonable value for the Open() thingy. If the actual value is greater, this doesn’t harm. The perfometer is drawn correctly anyway.
Or return an upper boundary from your check plugin and stick to the Closed() thingy. If the actual value is then greater, the perfometer is completely filled.