Hi Team,
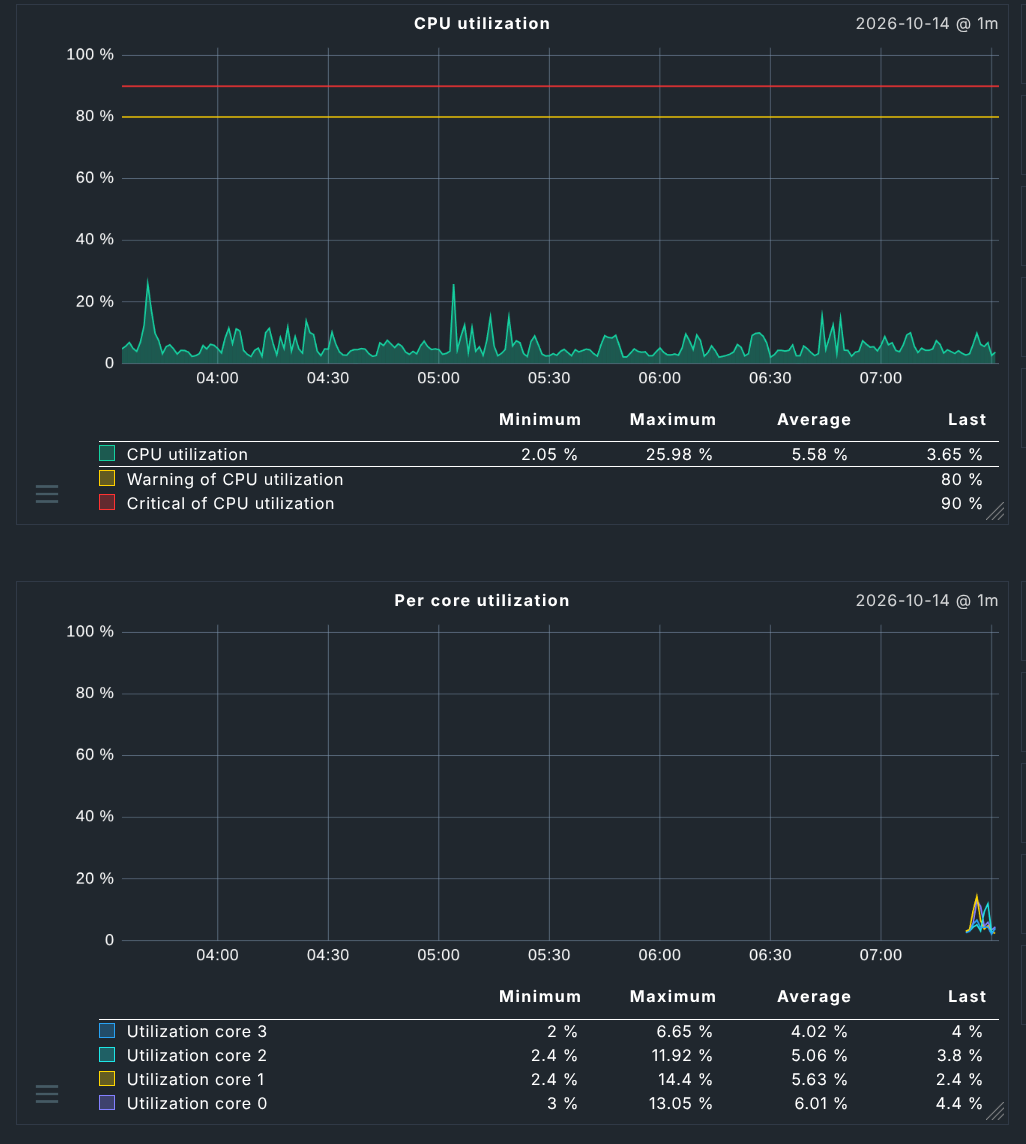
Can someone help to create a local check to monitor the vcenter cpu status. When trying to query the OID’s we found 4 vcpu’s but in checkmk we have only service CPU utilization. We need to monitor the vcenter’s CPU status separately.
You might want to look at monitoring your vcenter with the special agent instead of SNMP. Have a look at this article in the User Guide:
Hi,
We are already monitoring the vcenter via “Vmware ESX via Vsphere” but we are not able to montior the vcenter CPU status separately.
OK, I got it. This is data available via SNMP, but not via the special agent. Which Checkmk edition are you using? If you have a commercial edition, please file a ticket for an improvement. Development will than have a look whether the data is available via the REST-API.
For a quick fix, you might to create an SNMP plug-in that just reads the CPU data and creates additional services from it. Even if you have never written a plug-in, point Claude to the article and your SNMP walk and maybe ask him to have a look at other SNMP plug-ins shipped with Checkmk (here one with items will be generated):
We are using 2.4.0p35 Pro version
OK, most Pro users have support in their contract, so you might clarify first before creating a ticket. In case your contract does not contain support, please head to the ideas portal. Also: I found no 2.5 Werks hinting on per CPU monitoring. Still: there has been some cleanup, so you might spin up a 2.5 testing site (you do not need to use license data if you stay below 750 services) just to check whether the check in 2.5 provides more insight.
Hi,
Thanks for the heads up.
We would also like to know if anyother has developed any plugins or mkps to monitor these metrics.
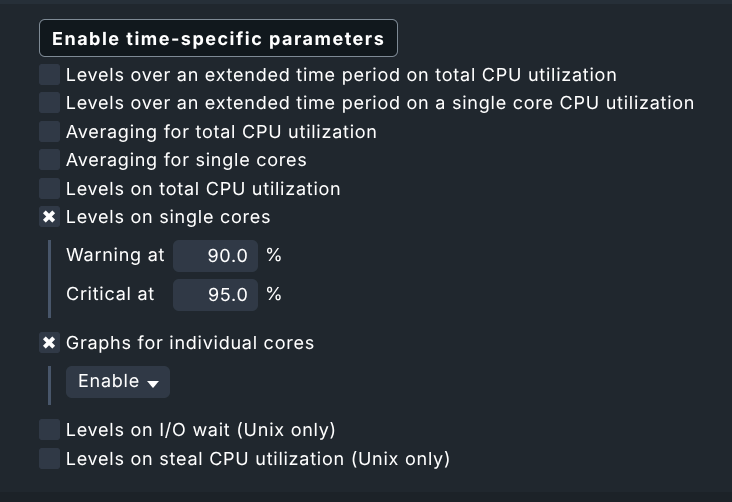
If i look at your first screenshot then this data is the normal data for the “hr_cpu” check that is inside CheckMK. If you use SNMP beside the special agent against your vCenter do you get the hr_cpu check discoverd? I would check this on command line with “cmk -vvI VCENTER”. The hr_cpu check has the option to define levels for every cpu core and to graph every cpu core. With default settings it only shows the overall usage.
Here an example from one of my SNMP devices that is using the hr_cpu data.