@BH2005
Currently, this network topology can use all the styles available in BI visualization.
Displaying hosts/interfaces in a top-bottom view introduces new problems
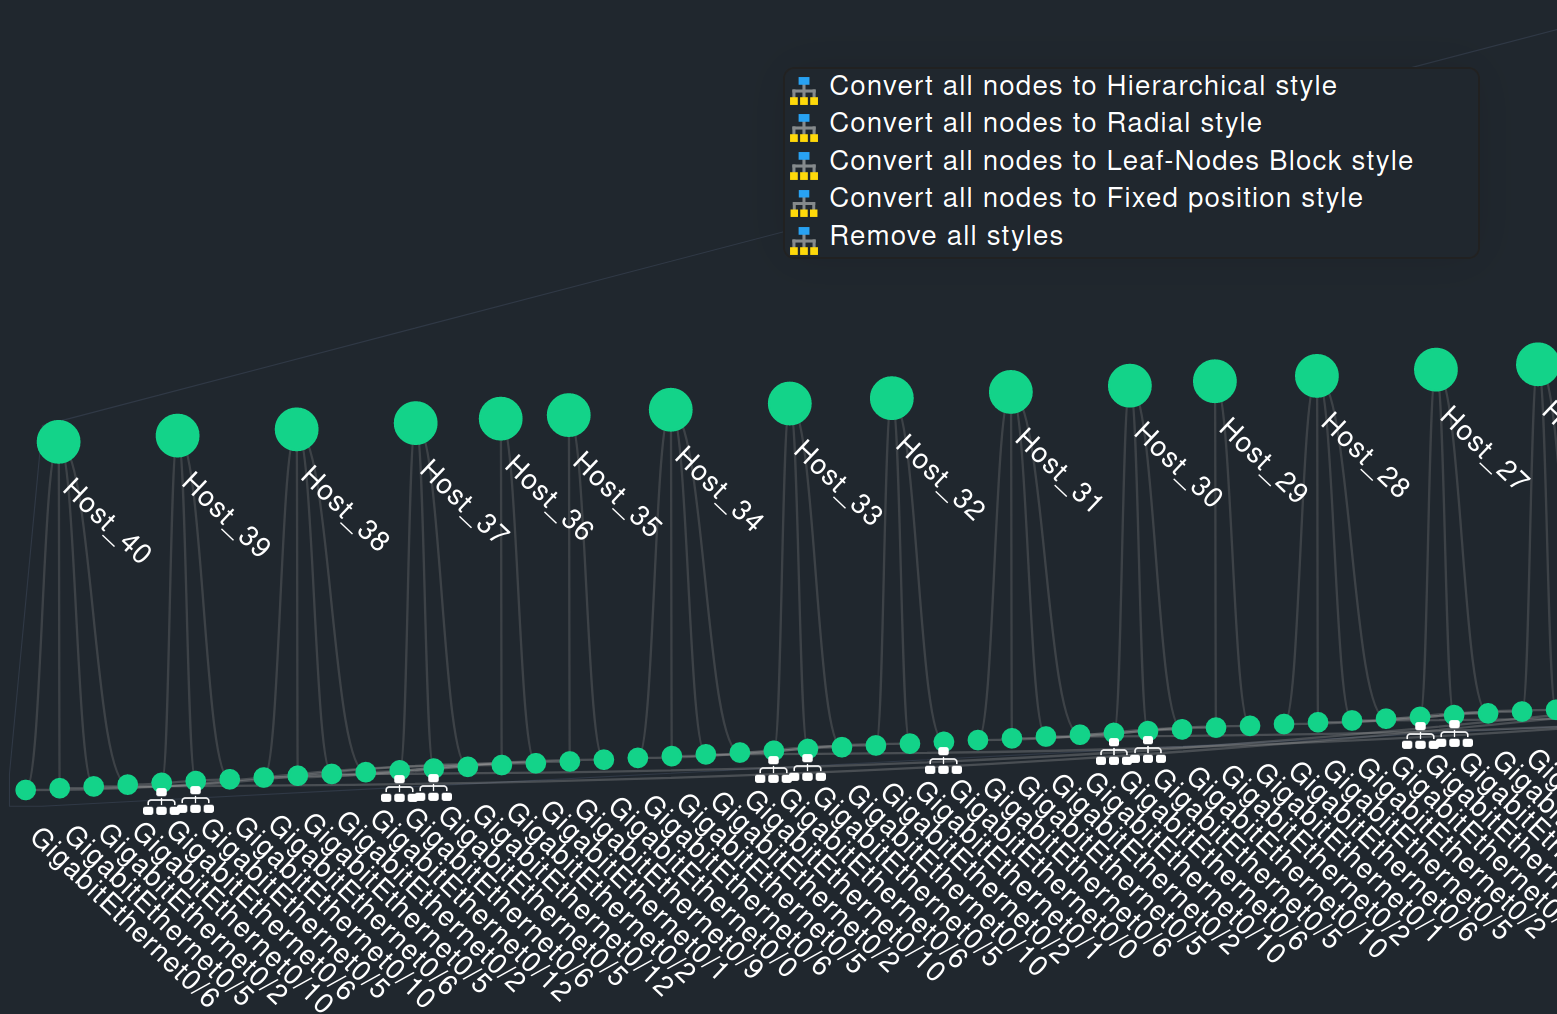
If all hosts share the same layer level you can not see the connections between the interfaces.
There is also no unique root node, from which a tree-like layout can be build.
However, it is possible to drag a host and its interfaces to a different position
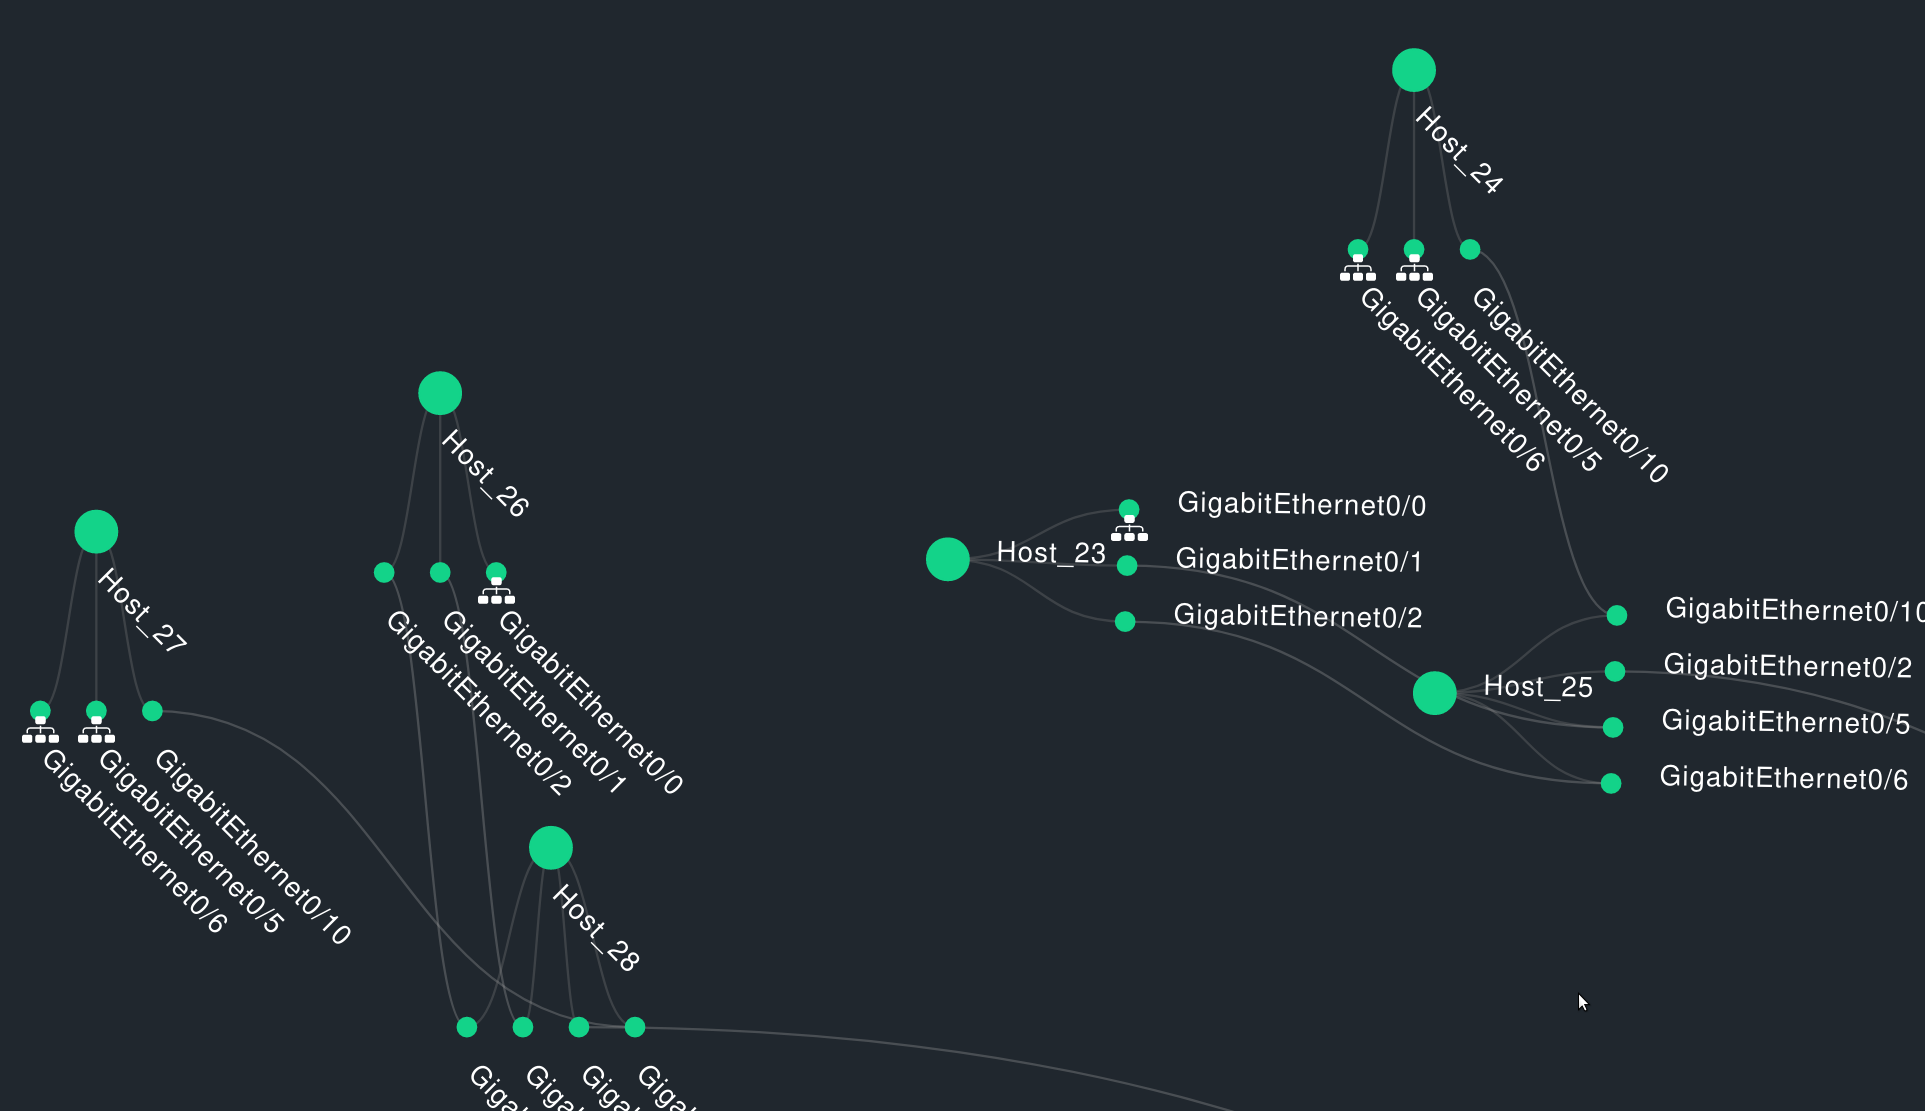
This layout can then be saved and reused later an.
Regarding the export of the shown hosts/interfaces. This shouldn’t be too hard, since the data is already available as json object in the frontend.