Network Visualization

Hello all,

at our last conference we already mentioned the following feature and said that we would “soon” offer it as MKP for version 2.2.

I finally had the time to do some additional polishing and make it MKP-ready.
Note that this feature is still under development and will most likely change over time.
I plan to put in additional work at the end of the year. Until then, I welcome feedback in this thread!


Network layer visualization

Purpose
Display network layer2 connections between hosts and interfaces.

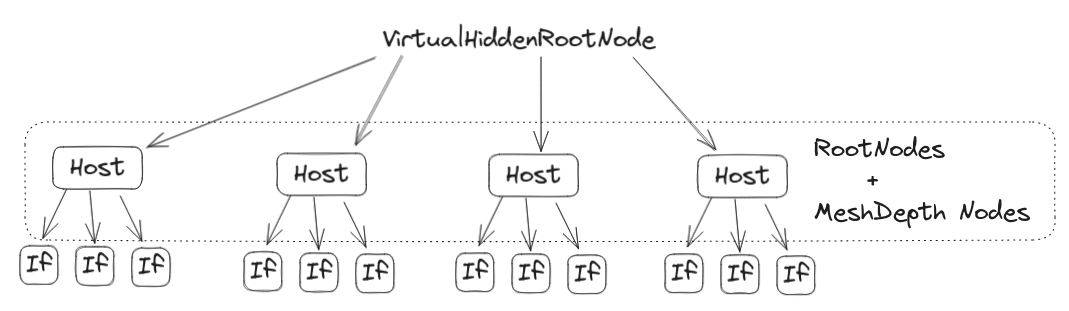
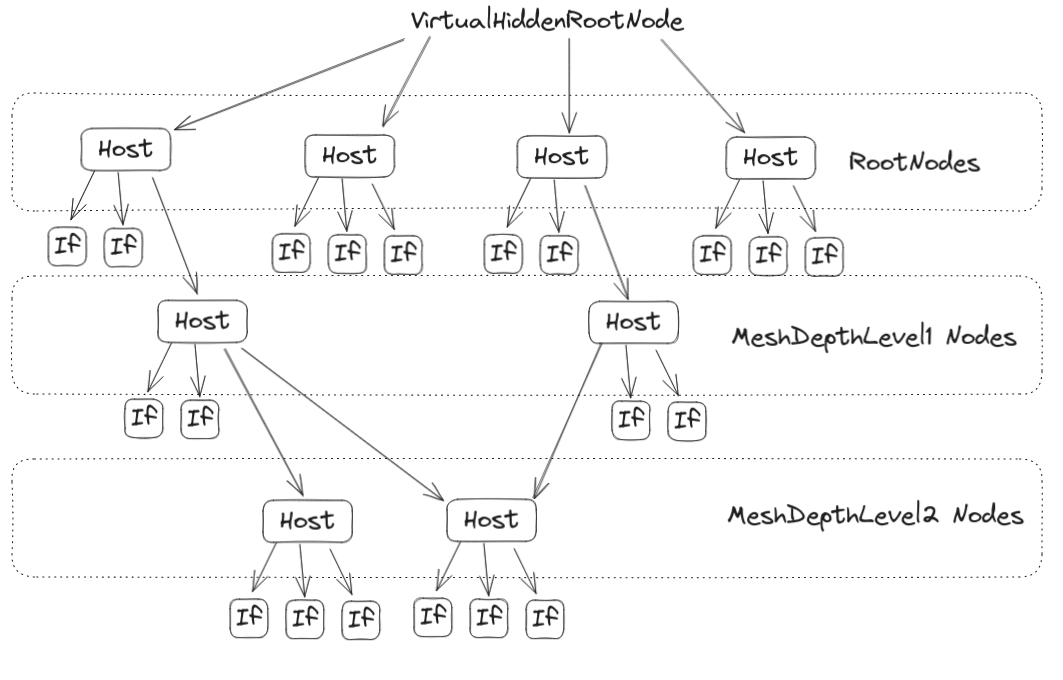
How is this mesh computed?
First, some start host(s) must be specified. This is done via the filter form, which is also used by the views.
Starting from these hosts, the topology mesh depth filter is used, which tells the algorithm how many hops from the starting nodes the mesh is to be extended.

Where does the information of the connections come from?
Its up to you to provide this information via a json file - and it will be in the foreseeable future.
Our first protoype used lldp data from switches to generate a file with the following format/content

json-data format:


{
 'HostA': {'connections': {'GigabitEthernet0/1': ['HostB',  'GigabitEthernet0/5', 'lldp'],
                                      'GigabitEthernet0/2': ['HostC',  'GigabitEthernet0/6', 'lldp']},
           'interfaces': ['GigabitEthernet0/1', 'GigabitEthernet0/2']},
 'HostB': {'connections': {'GigabitEthernet0/5': ['HostA', 'GigabitEthernet0/1', 'lldp'],
                                      'GigabitEthernet0/2': ['HostF', 'GigabitEthernet0/6', 'lldp']},
           'interfaces': ['GigabitEthernet0/5', 'GigabitEthernet0/2']},
....
}

A dictionary of host names with their respective interfaces and connections to foreign hosts/interfaces.
Further details can be found in the MKP description.

If you can not provide the data mentioned above, the network layer visualization will not work at all.


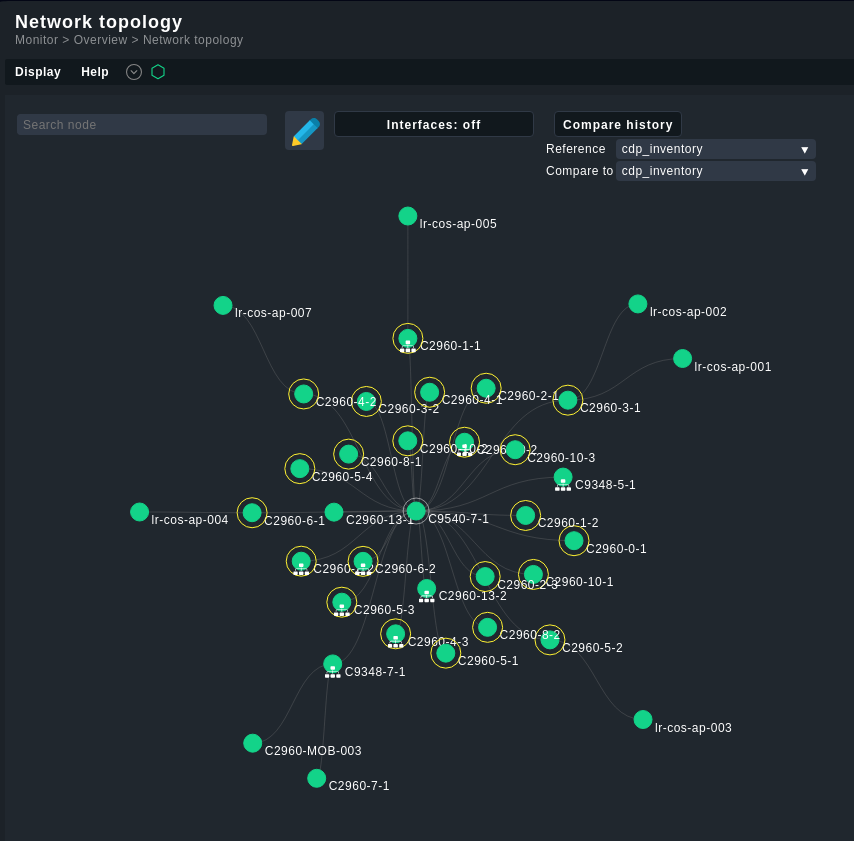
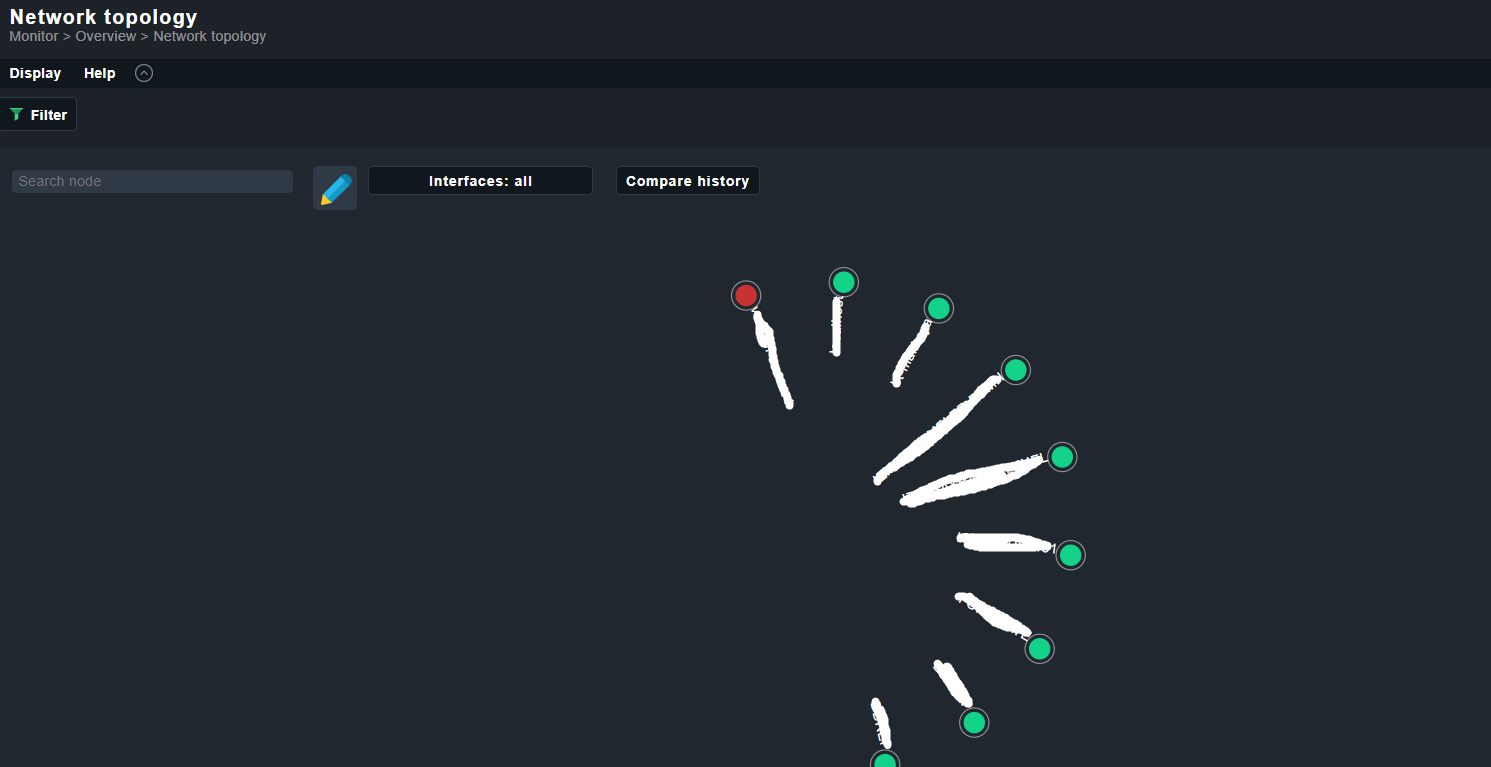
Once everything is setup correctly the following features are available

switch_problems
You can switch between different display modes.

  • Show only hosts
  • Show hosts and interfaces with problems
  • Show all hosts and interfaces


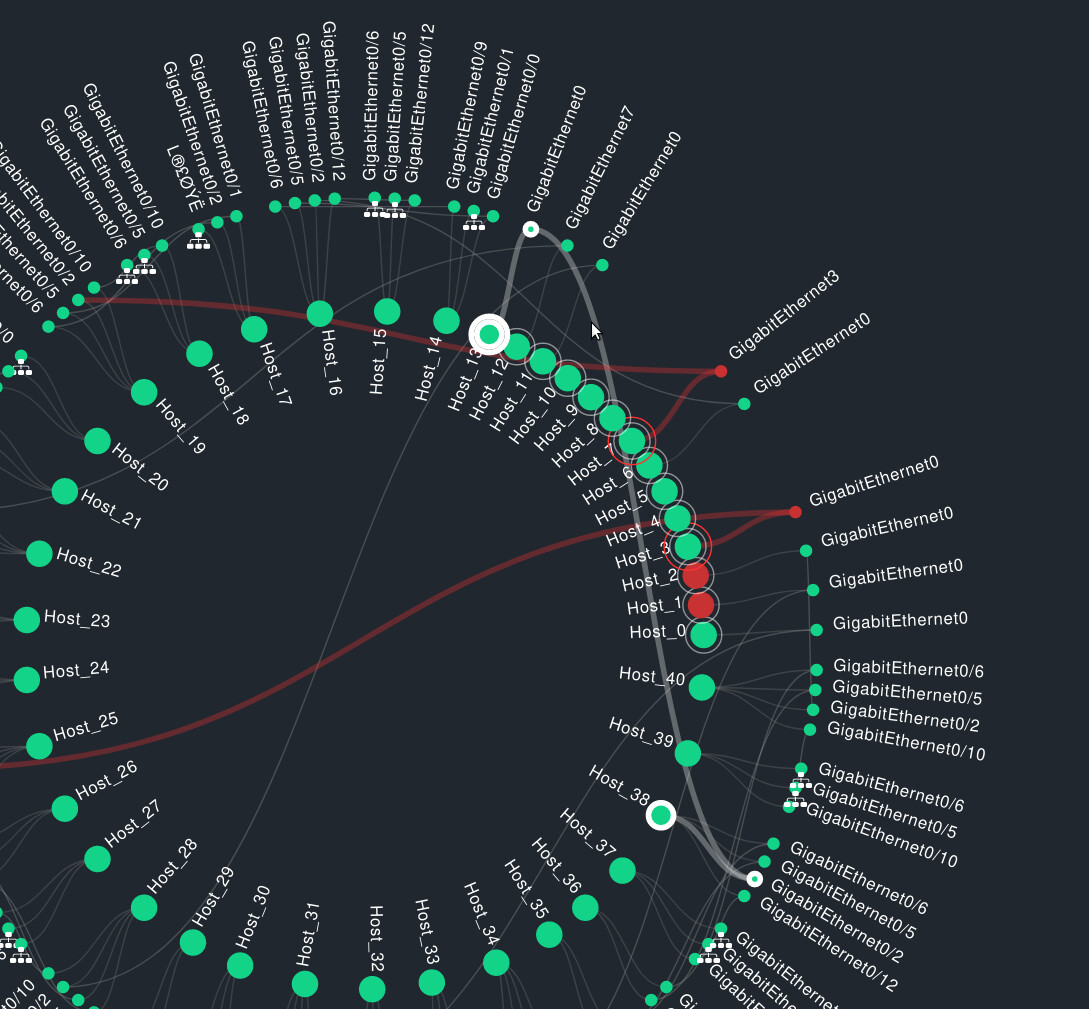
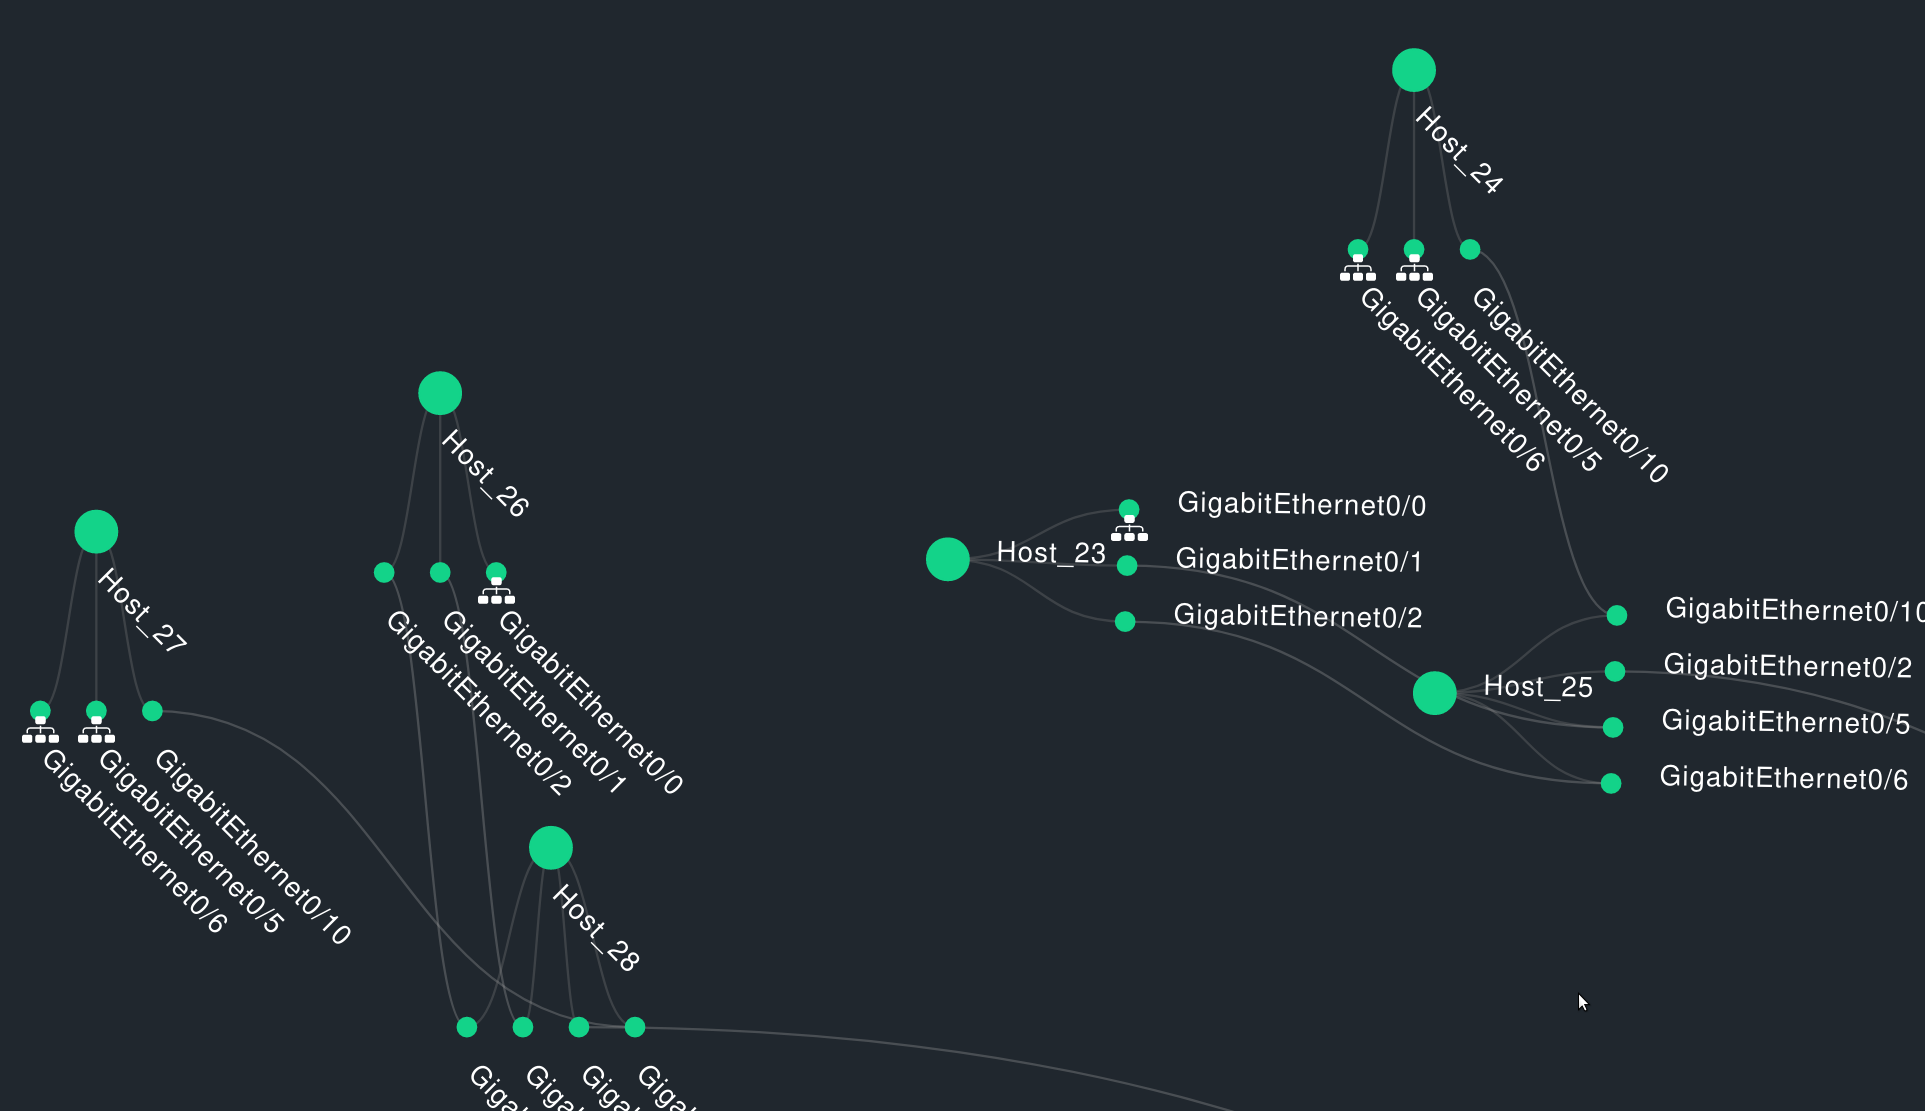
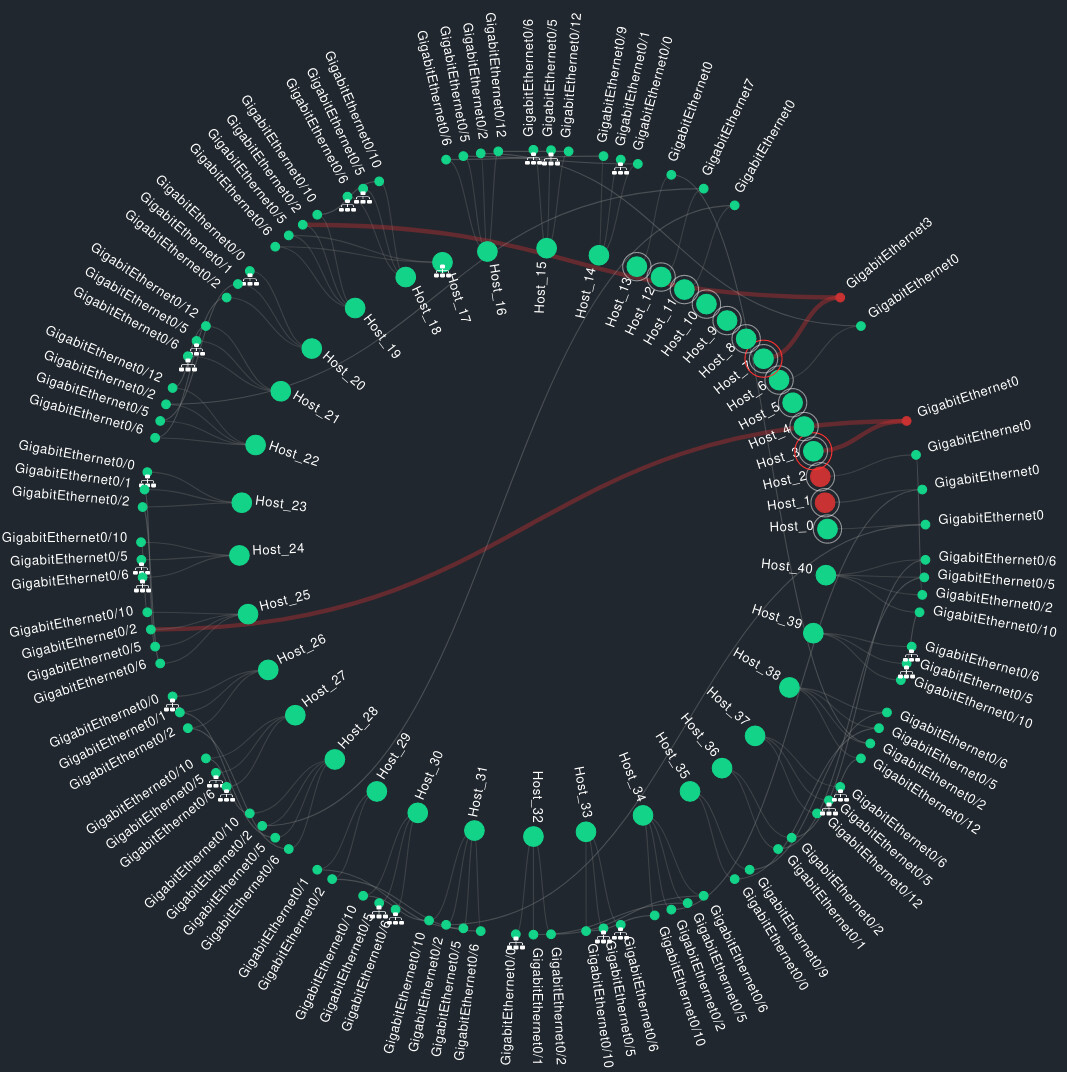
If you hover over an interface or a connection line, all involved elements are highlighted.


switch_styles
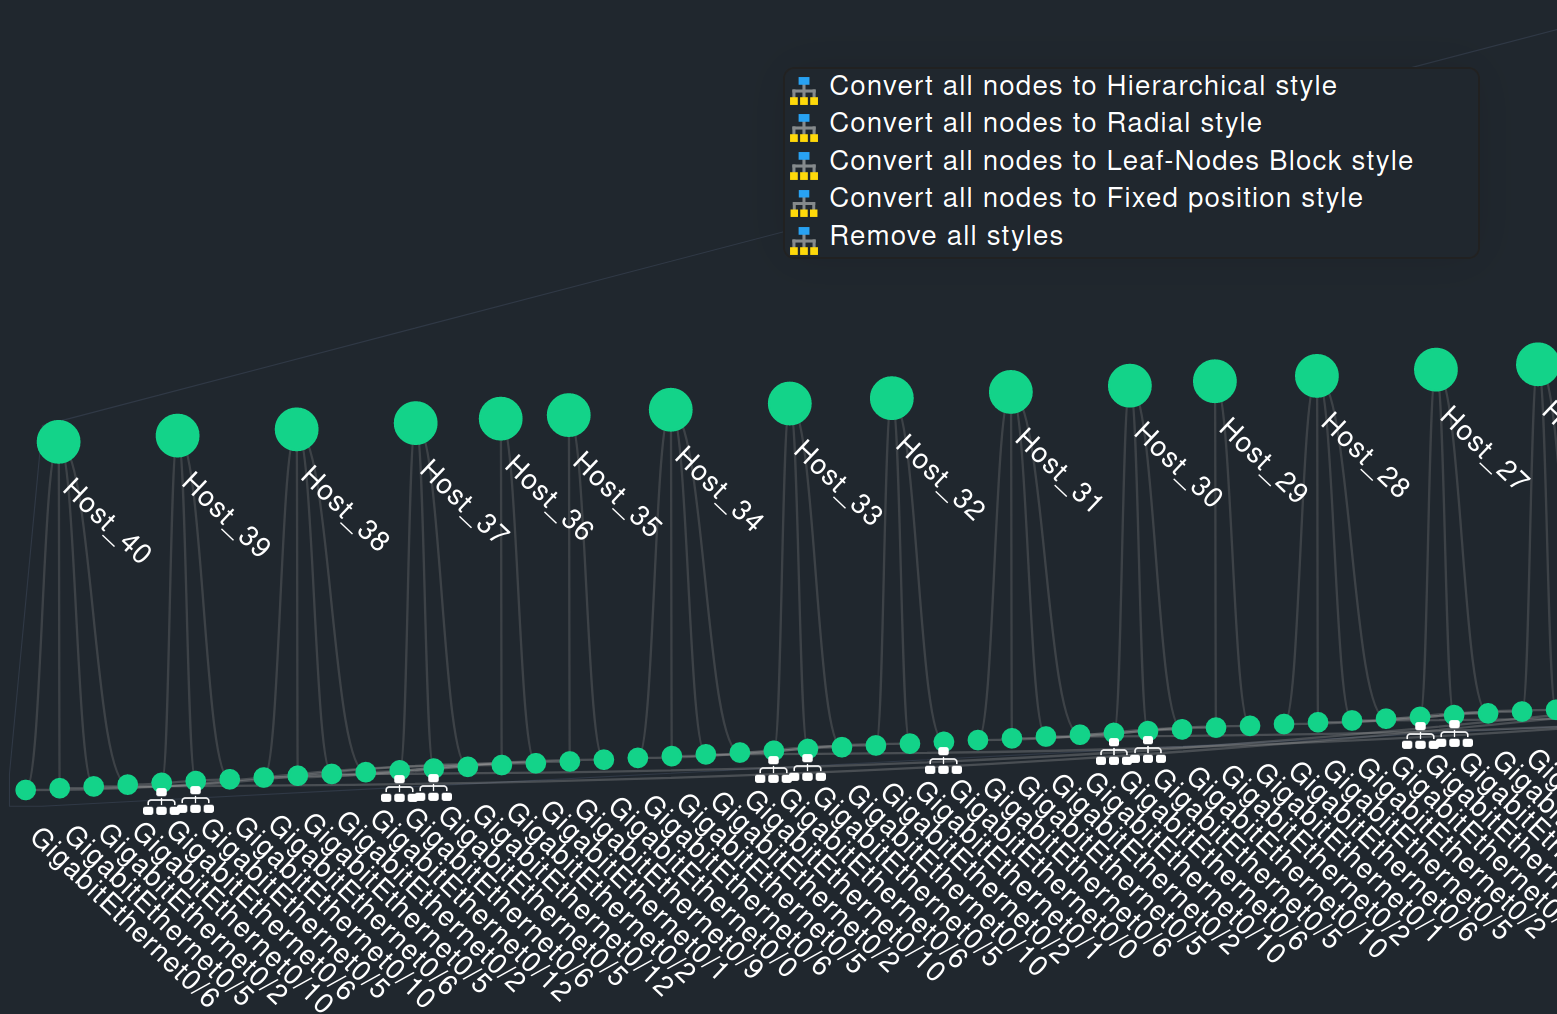
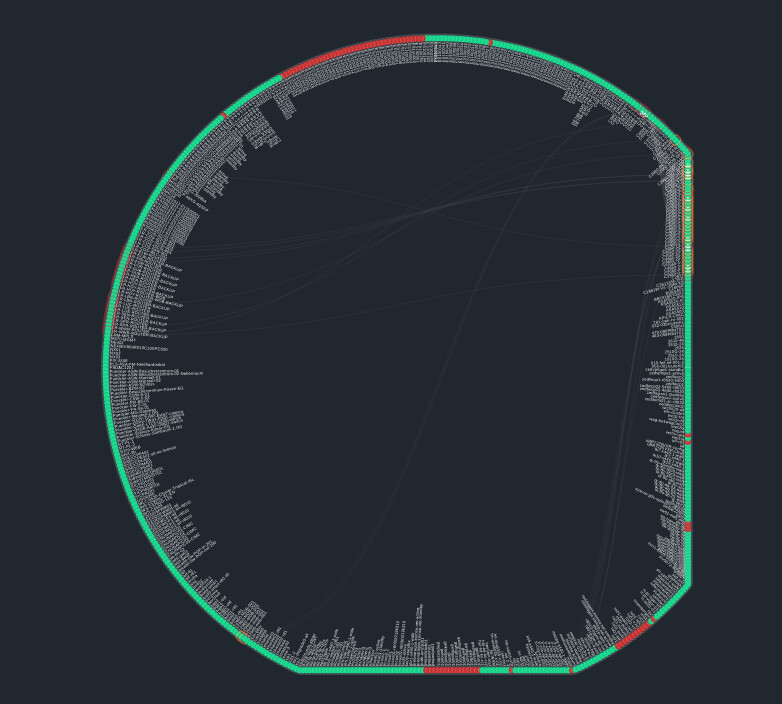
Choose between different representations. The radial layout is most of the time the best to get an overview


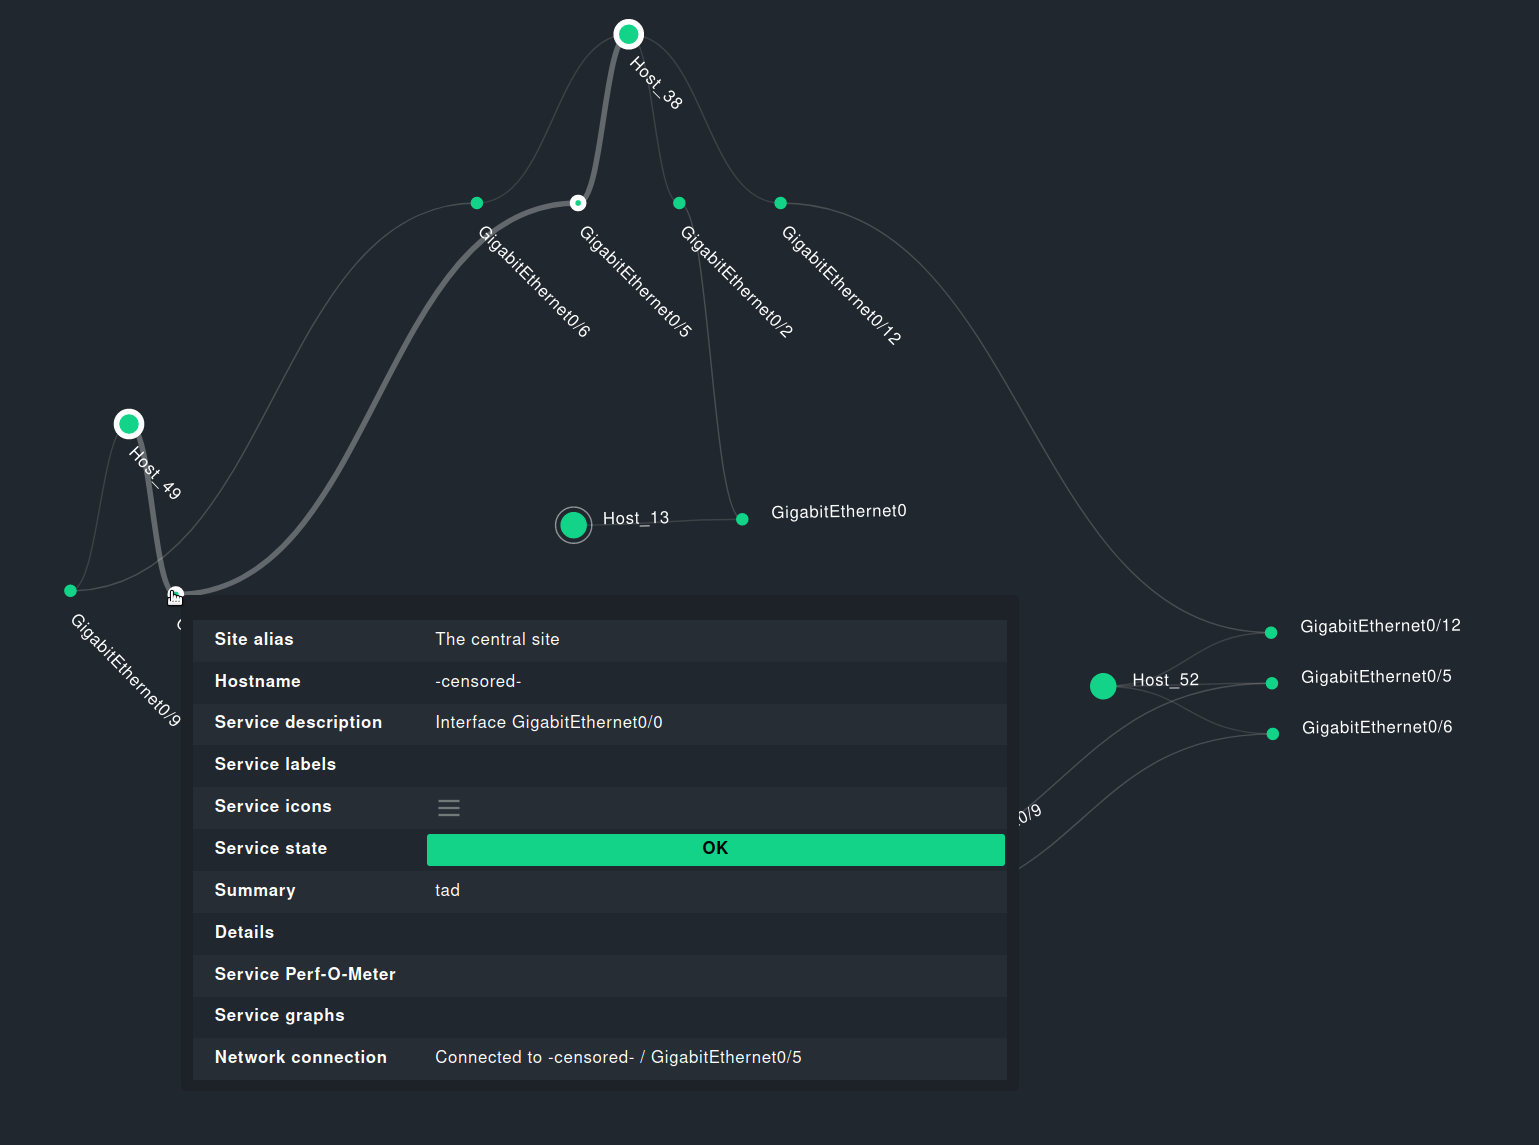
You can customize the view network_hover_service. The new painter “Network connection” is also included in this MKP


livesearch
This MKP also adds a customized filter form which automatically updates the data, once settings get changed.
It is more or less a gimmick I’ve added to allow a more fluid way of working - so no “Apply filters” button.


Future planned developments

  • Lots of UX redesigns
  • Show hosts specified in the connection data file, but not present in the monitoring core
  • Make network traffic between hosts visible, if we can somehow get that data
  • Use the same visualization mechanism to display a different type of data. For example, analyze netstat data to get an overview of client/server connections

Note:
There may be some visual glitches in the current implementation. Most of them disappear once you zoom in/out.
I will fix the problem later this year when this feature is included in the official version 2.3.


Checkmk Exchange Download: https://exchange.checkmk.com/p/network-visualization

8 Likes

@schnetz really nice. Looking forward to see this integrated in 2.3 :wink:
For now i have created a little script that uses the CMK inventory data
to create the json file (in my case from CDP data).
Maybe you can answer a few questions:

  • for what is the list of available interfaces used?
  • what is the intention behind the lldp field (i know it’s currently not used)?
  • where are the topology settings stored?

1 Like

Hi,

for what is the list of available interfaces used?
At the moment it serves no purpose, as we do not display hosts/interfaces that are unknown in the monitoring system.
A future version might highlight hosts/interfaces which are missing. We will probably change the list of names to a list of dicts, which may include more additional information.

what is the intention behind the lldp field (i know it’s currently not used)?
This is more or less a placeholder. It might be a good idea to add some dictionary here, too.
With the dictionary approach, this field can include things like traffic/error_rate/extra_icons/urls

where are the topology settings stored?

OMD[stable]:~/var/check_mk/topology$ ll
drwx------ 2 stable stable 4096 Oct  4 12:24 configs
-rw-rw---- 1 stable stable  122 Oct  4 12:24 topology_settings
OMD[stable]:~/var/check_mk/topology$

The topology_settings file links the “used filters” to an ID specified in the configs directory.


I am pretty sure that we will change the current data formats in a later version, as they are still based on the initial POC.

Thanks for the update.

I hope that these changes to the data format will be well documented so that this add-on can be fully used :slight_smile:

A thought on the location of the topology data, is there a reason not to move it to ~/var/check_mk since the config data is already there?

@schnetz @thl-cmk Very nice project. This is what i am really missing in checkmk

@schnetz @thl-cmk
thanks for this … it save a lot of time on the cli :wink:

@schnetz is there a possibility to switch the view from a circle to a Top-Bottom-View and an export function of the view to xml, json, csv will be a killer feature to easy export the data to an drawing tool like Draw IO, yEd or simalar to create network doku`s

:heart:

@BH2005
Currently, this network topology can use all the styles available in BI visualization.
Displaying hosts/interfaces in a top-bottom view introduces new problems

If all hosts share the same layer level you can not see the connections between the interfaces.
There is also no unique root node, from which a tree-like layout can be build.

However, it is possible to drag a host and its interfaces to a different position


This layout can then be saved and reused later an.

Regarding the export of the shown hosts/interfaces. This shouldn’t be too hard, since the data is already available as json object in the frontend.

thats true and multiple root nodes arent possible ???
Referenz to _key ?
or to set the called node as root

Greets

I think an actual tree like layout can be done. In the current version the backend reports the data in a simple format

{ 
    hidden_root_node: {
      children: [{all_other_nodes}]
}

Out of this information this graph is generated. Everything is on the same level

If I change the data format to

{ 
    hidden_root_node: {
      children: [
          {
              other_node_1: {
               children: [{other_node_5: {...}]
          }
          {
              other_node_2: {
               children: [{other_node_6: {...}]
          }
          {
              other_node_3: {
               children: [{other_node_7: {...}]
          }
       ]
}

it will be shown as

The browser frontend is already able to display this treelike structure, since this layout is used in the visualization of the BI aggregations.

1 Like

the definition of the root nodes could be done in the

create_topology_data.toml

during the creating of data`s

e.g.
root_nodes = the extended version of seed_device + leveling informations

root_nodes = [
    ["host1", "root"],
    ["host2", "root"],
    ["host3", "level1"]
    ["host4", "level1"]
    ["host5", "level1"]
    ["host6", "level2"]
    ["host7", "level2"]
    ["host8", "level2"]
]

or more simply via a defined host label in the Host proberties via GUI
e.g.

cmk/net_topo:root
cmk/net_topo:level1
cmk/net_topo:level2

This needs a new field in the topology data structure, I.e.

    'HostA': {
        'level': 0,
        'connections': {
            'GigabitEthernet0/1': ['HostB', 'GigabitEthernet0/5', 'lldp'],
            'GigabitEthernet0/2': ['HostC', 'GigabitEthernet0/6', 'lldp']},
        'interfaces': ['GigabitEthernet0/1', 'GigabitEthernet0/2']
    },
    'HostB': {
        'level': 1,
        'connections': {
            'GigabitEthernet0/5': ['HostA', 'GigabitEthernet0/1', 'lldp'],
            'GigabitEthernet0/2': ['HostF', 'GigabitEthernet0/6', 'lldp']
        },
        'interfaces': ['GigabitEthernet0/5', 'GigabitEthernet0/2']},
....
}

I’ve already discussed this level-topic with BH2005 via PM.
The conclusion was that we should not explicitly specify the level for any host.
There may be multiple network views where this host is shown in different contexts/levels.

Additionally, if a host is set to level2, it still would need some parent node which is placed in level1.

Ah, now i see the misunderstanding I’ve probably introduced in my last message, where I’ve talked about changes in the data format. I wasn’t referring to this topology data format

    'HostA': {
        'connections': {
            'GigabitEthernet0/1': ['HostB', 'GigabitEthernet0/5', 'lldp'],
            'GigabitEthernet0/2': ['HostC', 'GigabitEthernet0/6', 'lldp']},
        'interfaces': ['GigabitEthernet0/1', 'GigabitEthernet0/2']
    },

This format here is the internal format, which is computed out of the topology format

{ 
    hidden_root_node: {
      children: [
          {
              other_node_1: {
               children: [{other_node_5: {...}]
          }
          ....

The data above is basically calculated with this mechanism

  • Determine the root nodes: These come from the filter form on the right side
    The filters lead to a livestatus query, the returned hosts are the root nodes
  • Growing phase: Based on configured mesh depth additional iterations are run
    The level of a host will be set by the number of the current iteration
  • Interface phase: Add interfaces to the hosts, determine connections to other hosts
2 Likes

If found a strange problem with following host setup.
All our hosts inside CMK have a customer prefix like.
CM1_hostname or CM2_HOSTNAME.
It is no problem to generate the json file with the correct structure but the visualization extension has a problem with “_” inside the host names.

Result at the moment complete empty view and no error message :slight_smile:

Known problem. The current implementation uses some ugly string joining/splitting with _ as delimeter
I’m going to continue this visualization topic in ~2 weeks and will probably rewrite most of the current code to support a wider range of visualization formats (lldp/netstat)

Veriy nice :slight_smile: Here my wishlist (if i may):

  • Hide/show host/interface labels
  • Show nodes that are not present in CMK
  • Visualisation of the connection bandwidth
  • Visualise duplex/half-duplex state
  • Different shapes per node (switch/router/ap/cloud/…)
  • Show/hide different layers (CDP/LLDP/…)
  • show a legend for all the icons

At a last an “issue”: If you remove the last root node, the visualisation shows all hosts present in CMK.

I patched the current version that it uses “:” as delimiter. This should be nearly safe :smiley: as it is a forbidden character inside CMK host names as also in DNS and Netbios names.

3 Likes

the “:” is used by some vendors in the interface name → Extreme

But “:” is not allowed as part of the host name.
And the problematic split is “hostname.port description” - take the first element as hostname.
I think it is not relevant what comes later inside the port description.

I use this exchange in my topology. I also installed it by following all the steps but in my network topology page I see only 9 hosts but I have 498 hosts. Why can’t I see them all?
There is no connection between the 9 hosts that appear. What is the reason why they are not all visible, what can I check?

CMK Version: Checkmk Raw Edition 2.2.0p16