Hi all,
this feature has finally landed in version 2.3. I already talked about it in the last thread, but since there have been many data/UX/feature changes, I will write a short overview here.
We are planning to publish a blog article in the next few weeks in which we explain the configuration in more detail.
What is it about
Visualization of dependencies between objects
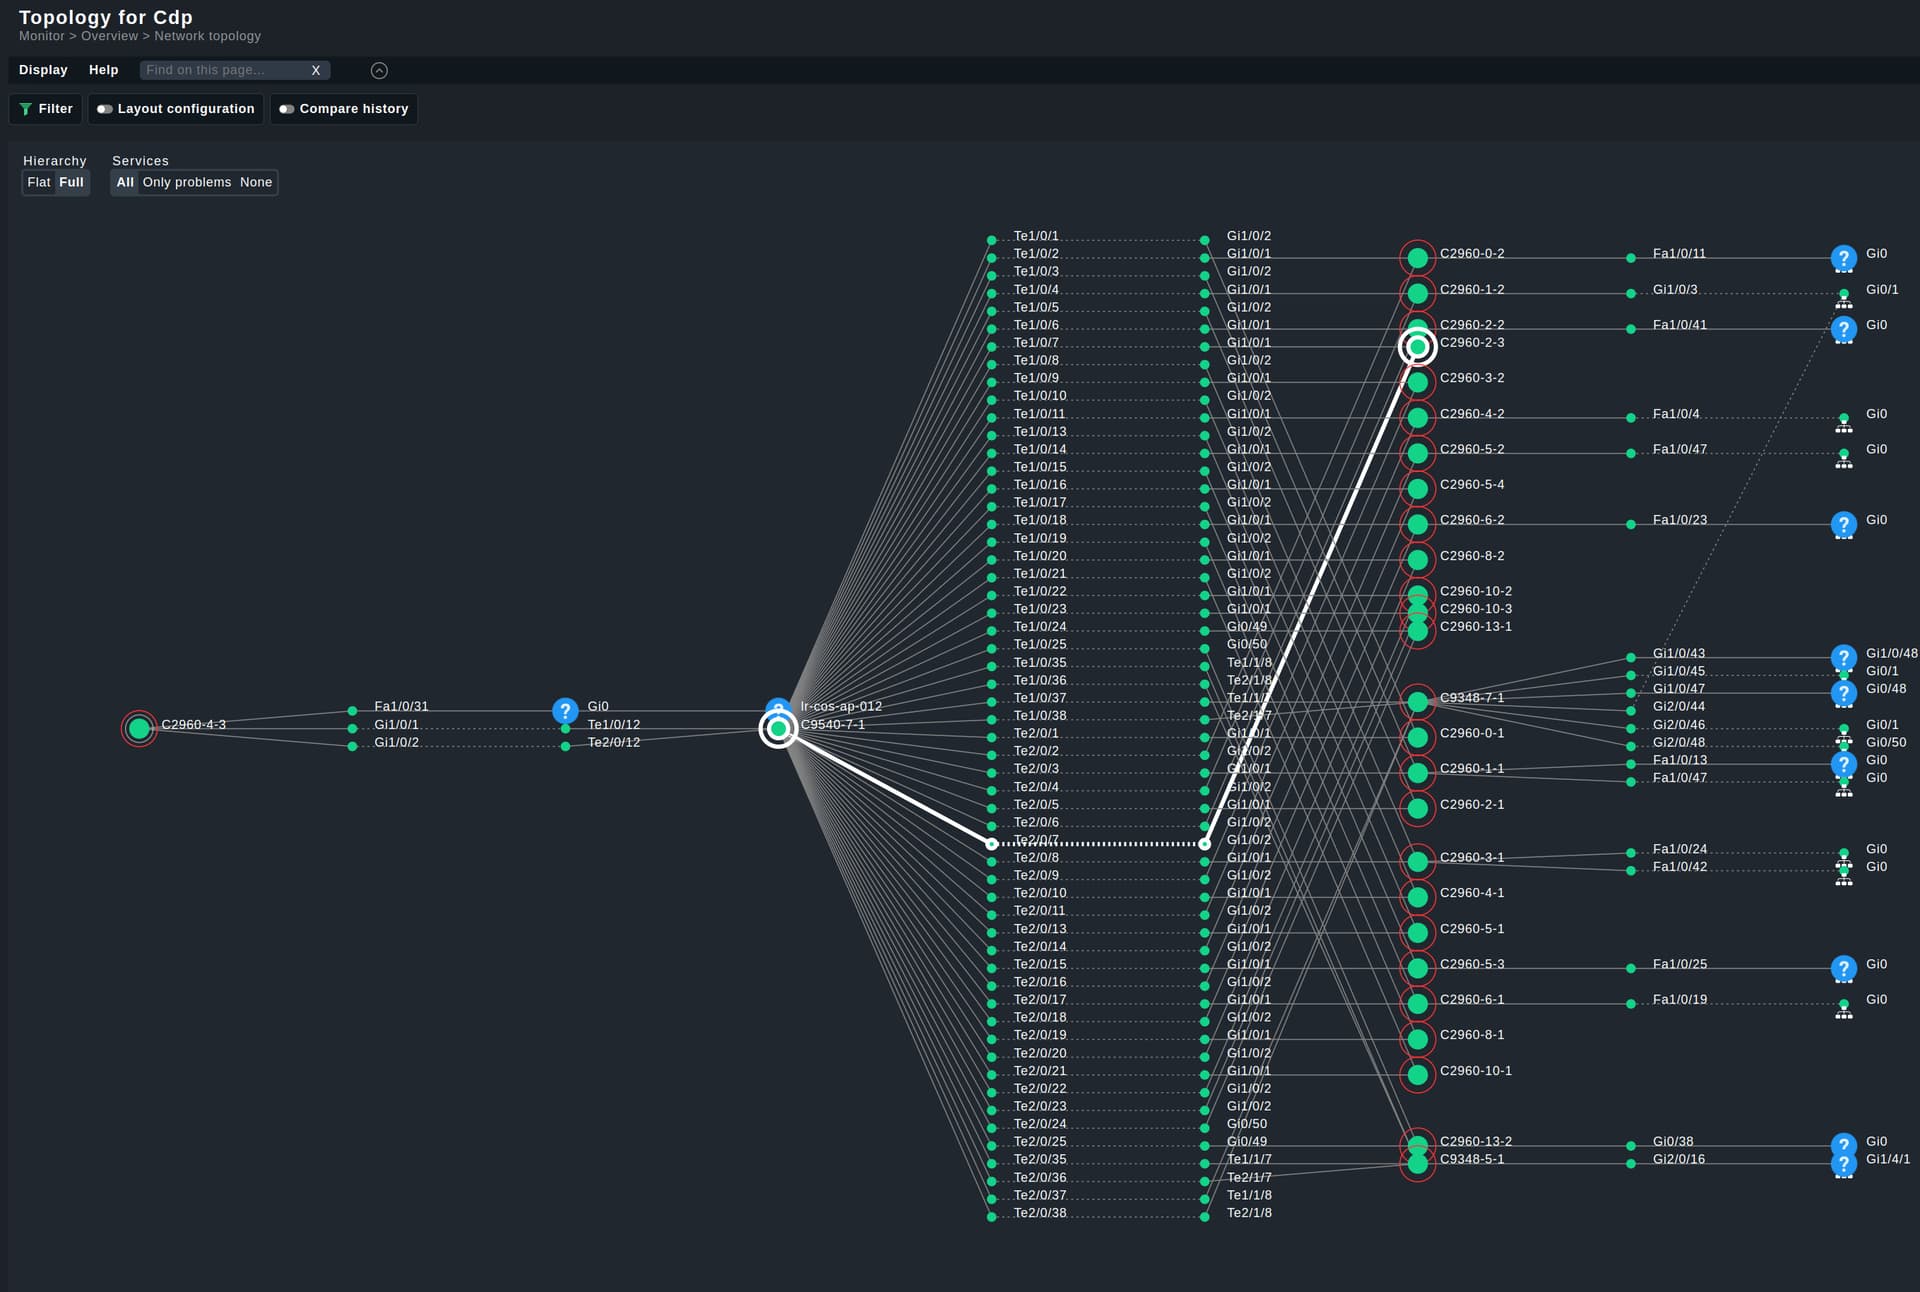
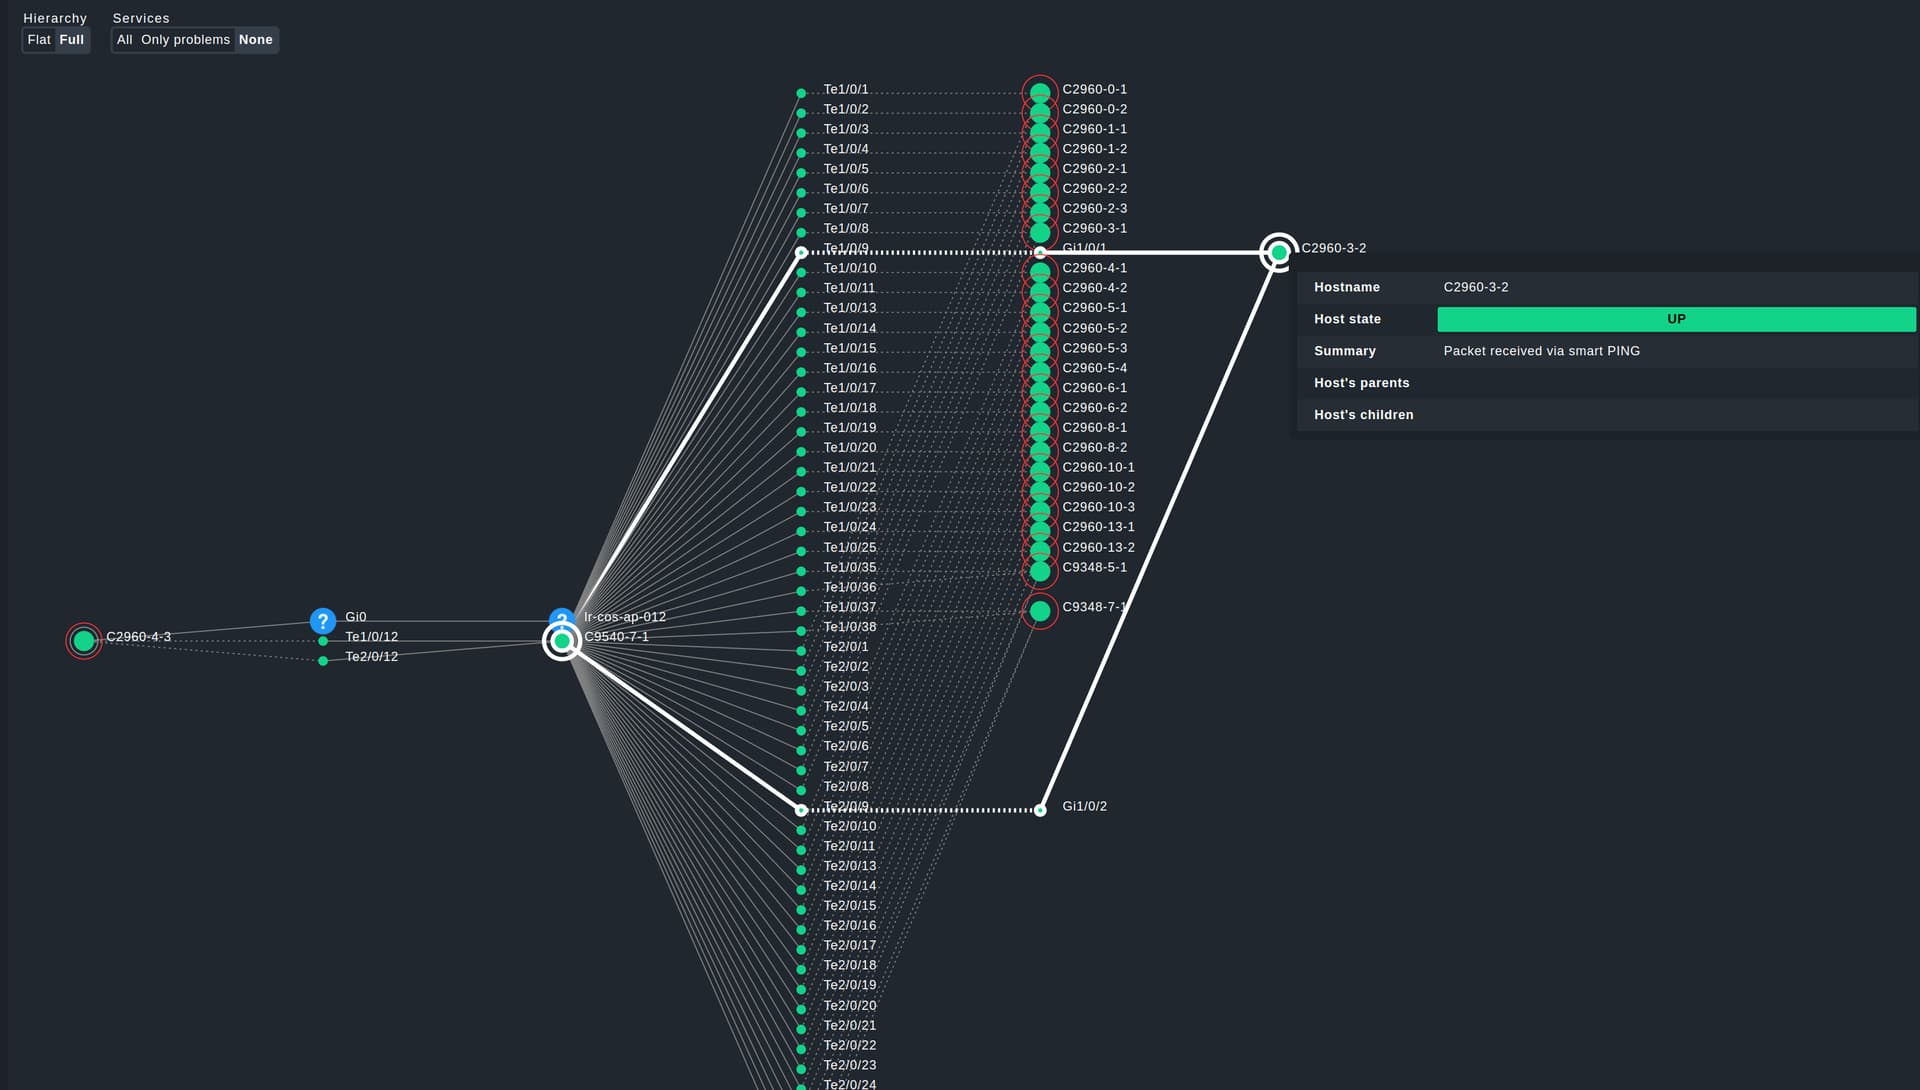
The figure above shows the CDP relationship between hosts and their interfaces.
It also shows the current status of the hosts/services and provides links to the appropriate views.
The data for this relationships is currently not computed by Checkmk, but there are MKPs in the works which generate data for LLDP/CDP and netstat.
Different visualization styles
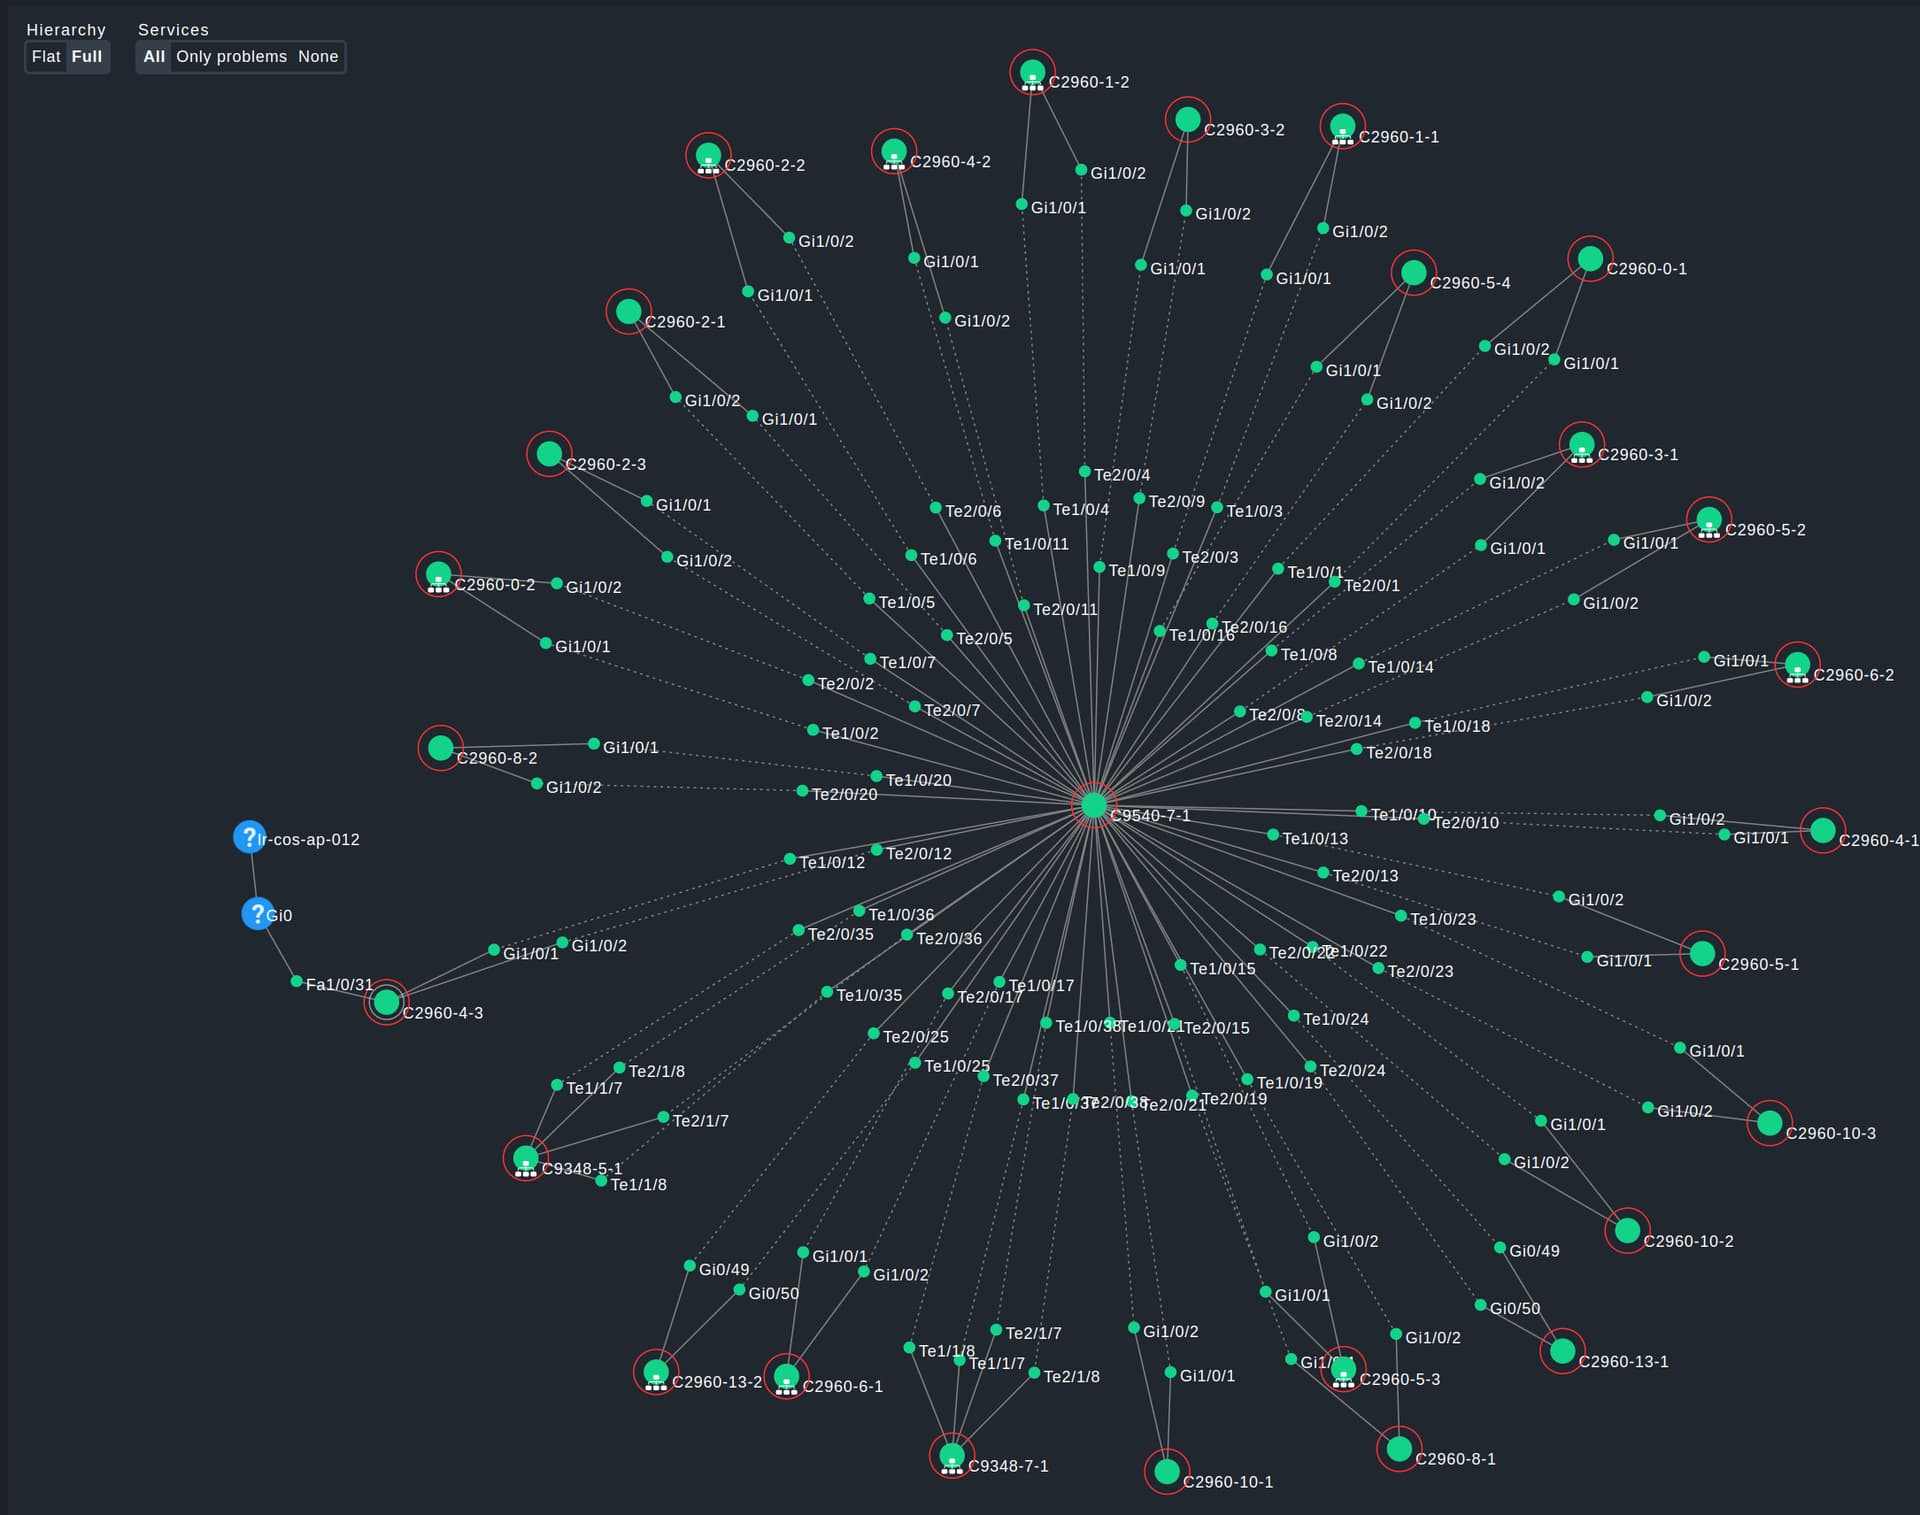
With the layout designer you can make it as beautiful/ugly as you want (I’m not good at it…)
Service visibility
Services can be generally set to hidden. This only shows the connections between hosts and reduces visual overload.
You can set that only services with problems are displayed or that only services for certain hosts are displayed, as shown in the figure below.
Check differences between different timestamps
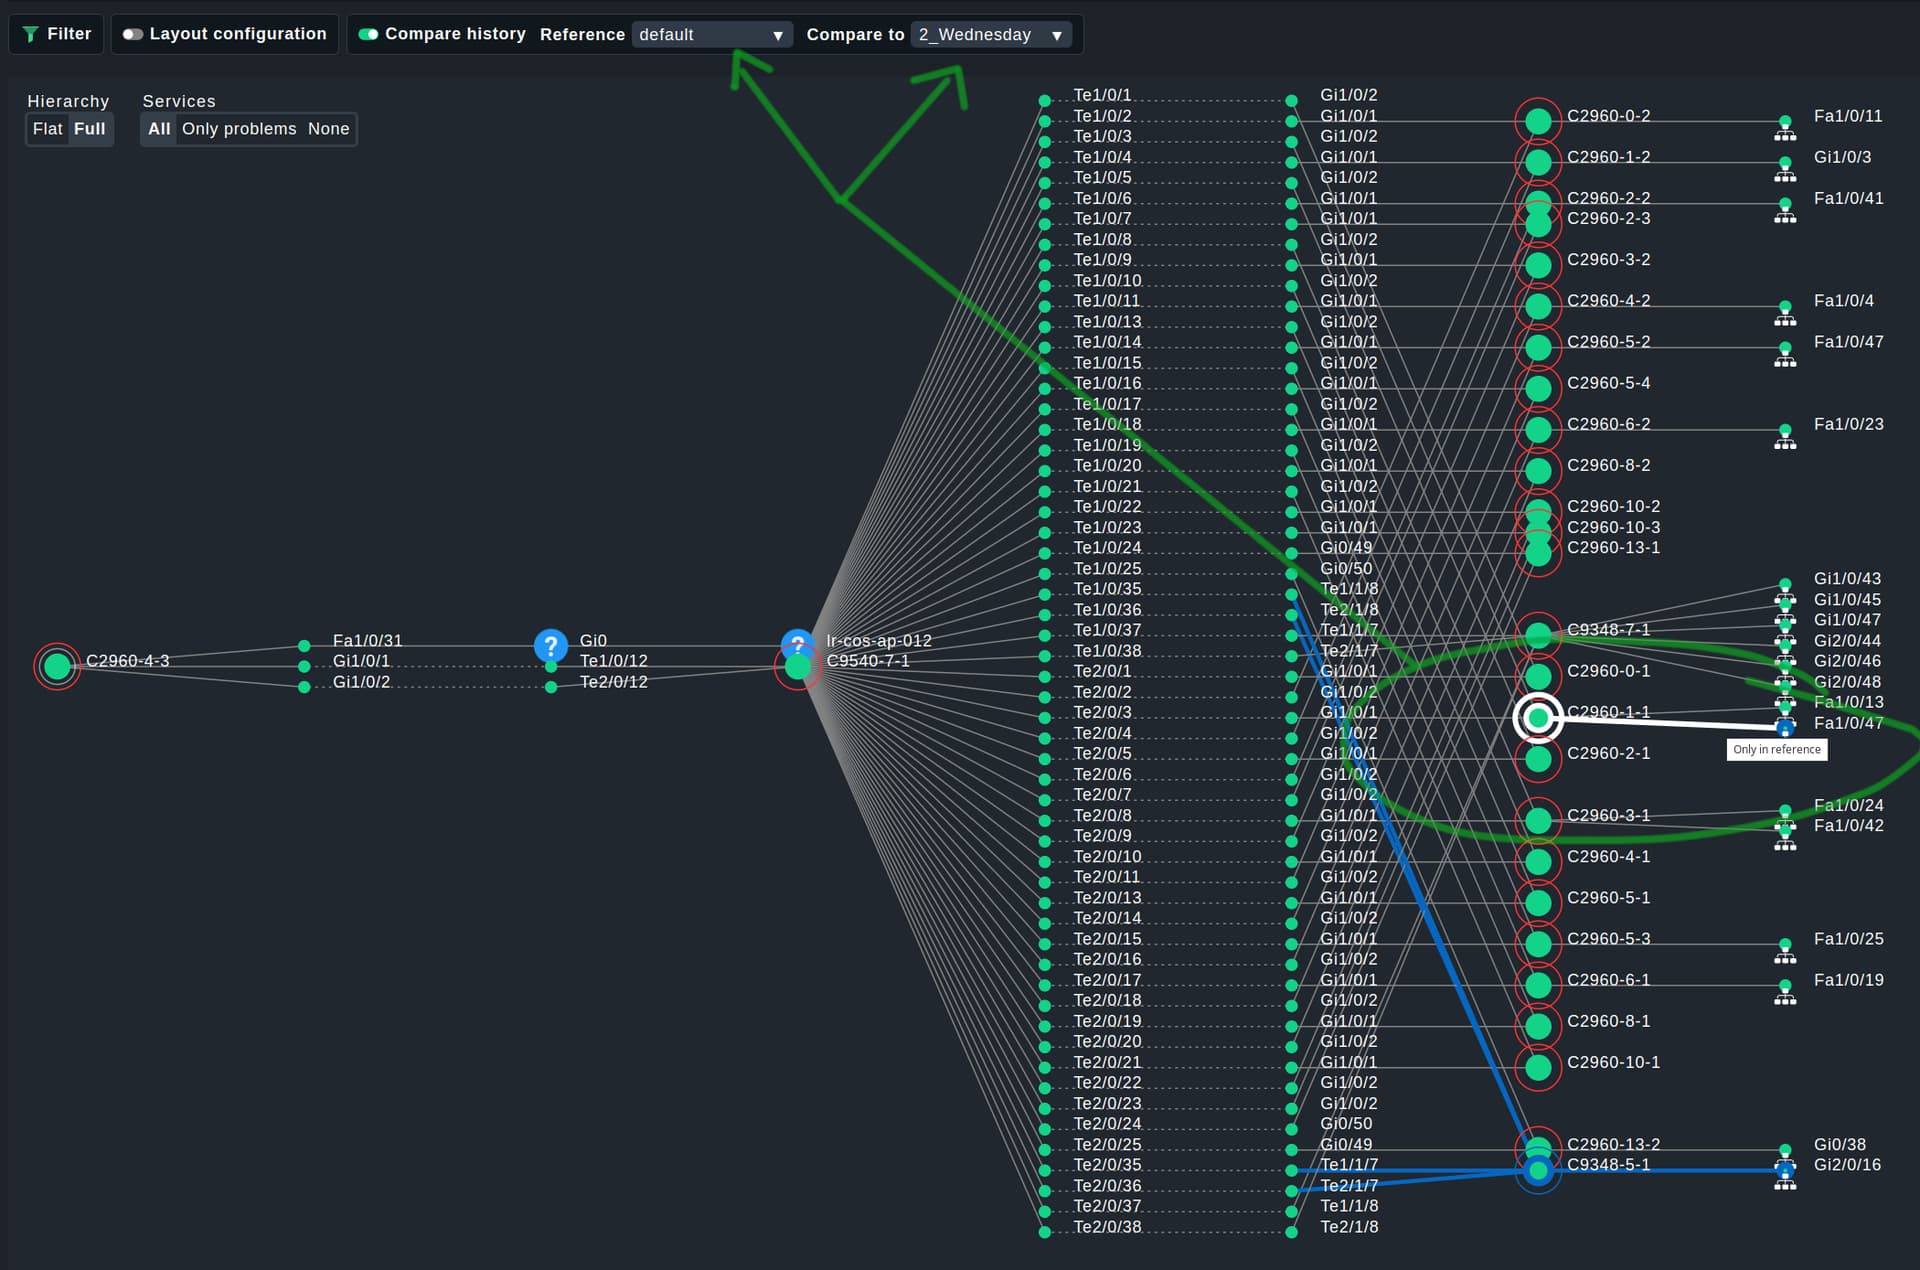
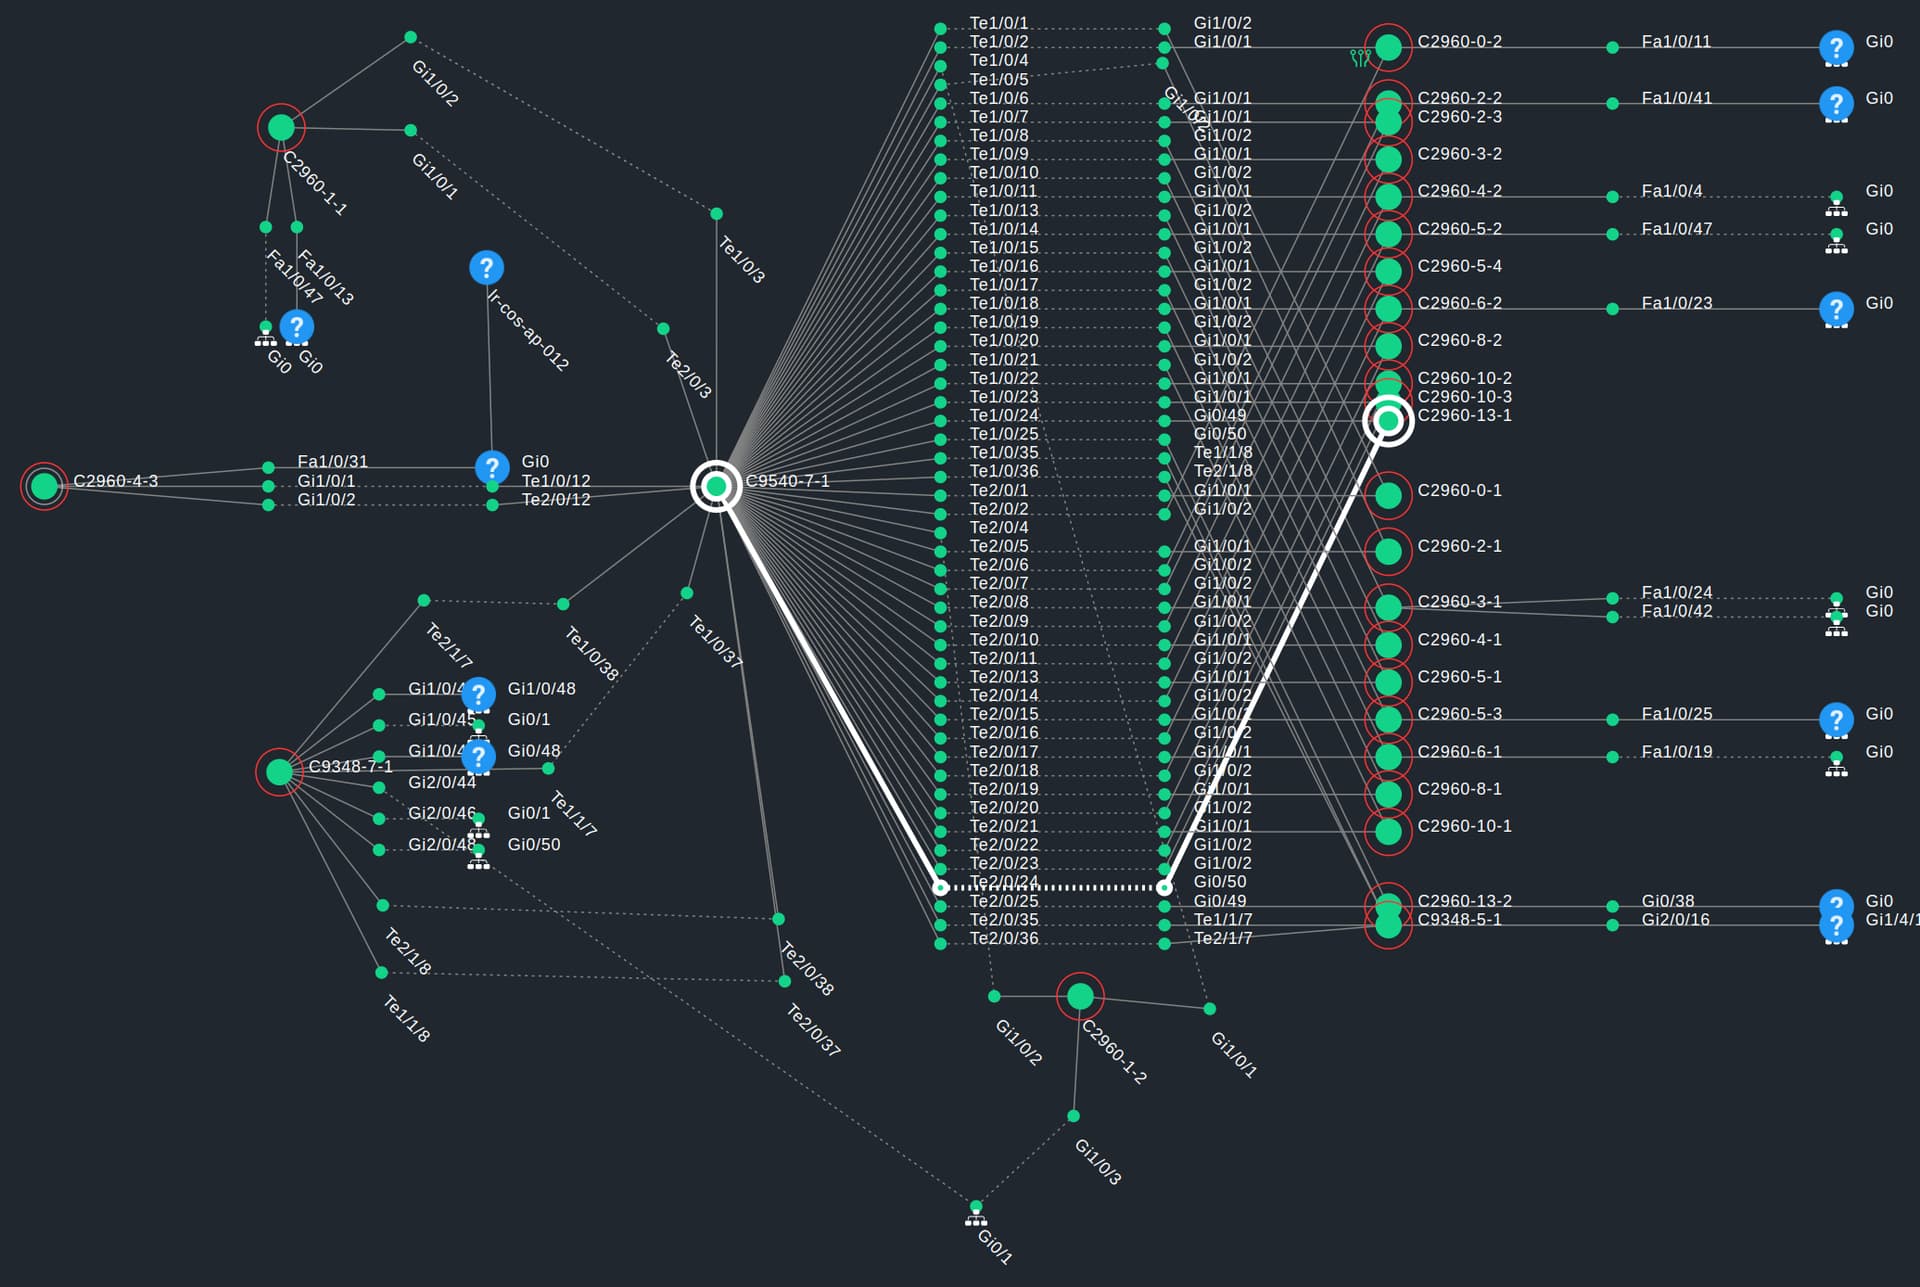
Automatic growth depending on configured mesh depth
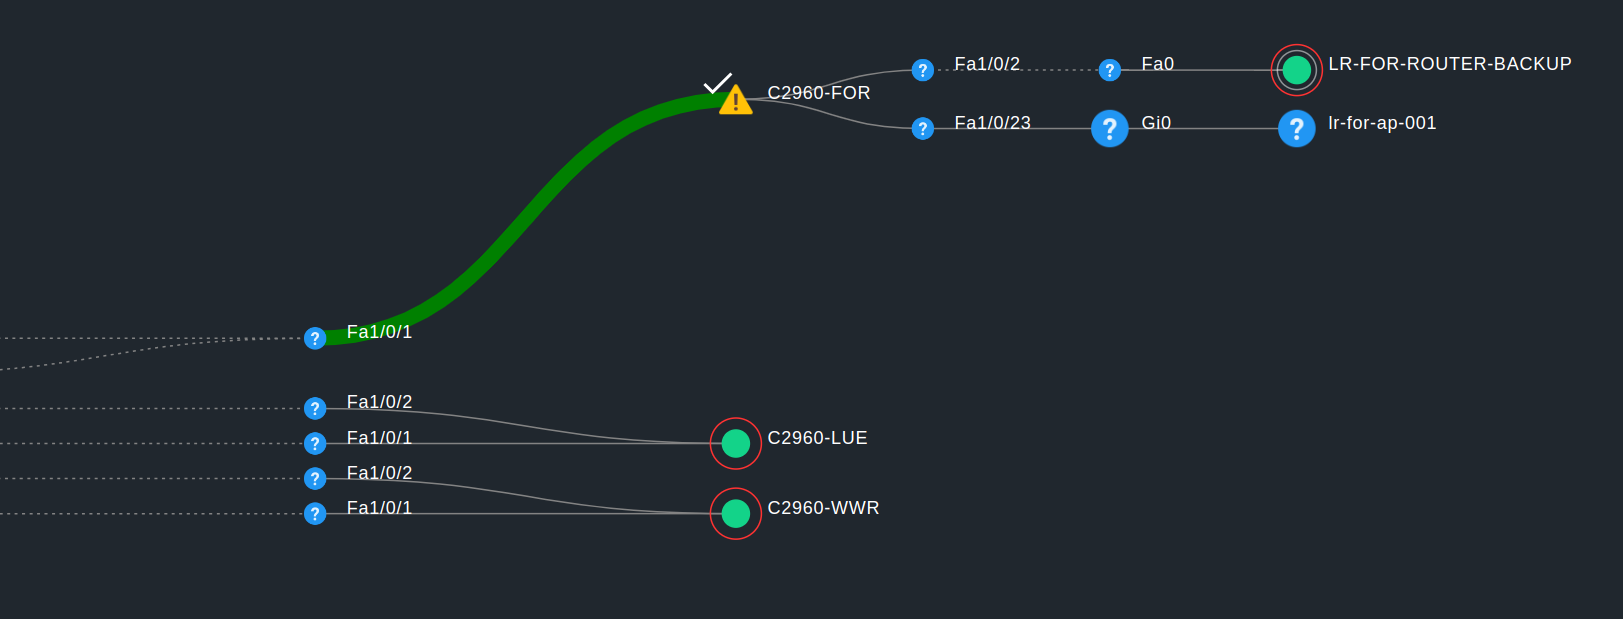
Assign custom node and link styles
This example shows a custom emblem(warning sign) and icon (check mark) for the node C2960-FOR and a connection line with a customized color and thickness
Data format
There is always one data file for each data type for a given timestamp.
The data is divided into two main components
- The objects, which represent the nodes in the visualization
- The connections, which describe the connection between objects
{
    "version": 1,       # data format version
    "name": "CDP data", # some name to display somewhere
    "objects": {        # A dictionary containing the object ID key and the object as value
        # A generic node with the ID NodeA and the display name 'NodeA'
        # It is a simple node with no relationship to the monitoring core
        'NodeA': {'metadata': {}, 'name': 'NodeA'},

        # A node with the ID HostA_ID, which is linked to a host 'HostA' in the core.
        # In the visualization the node is named 'HostA Name'
        'HostA_ID': {'link': {'core': 'HostA'}, 'metadata': {}, 'name': 'HostA Name'},

        # A node with the ID HostA_ServiceX, which is linked to a service
        # 'HostA'/'ServiceX' in the core. In the visualization the node is named 'Service X'
        'HostA_ServiceX': {'link': {'core': ['HostA', 'ServiceX']}, 'metadata': {}, 'name': 'Service X'},

        # The metadata field is used to add additional information.
        # A generic node with the ID NodeWithImages and the display name 'ImageNode'
        # This generates a node which is shown in the screenshot above
        'NodeWithImages': {'metadata': {
                             'images': {"icon": "icon_checkmark", "emblem": "emblem_warning"}
                           },
                           'name': 'ImageNode'},
    },
    # The objects are always identified by their ID
    # A connection always connects two objects and has tree values [SOURCE_ID, TARGET_ID, metadata]
    "connections": [
        # A simple connection between NodeA and HostA_ID
        [["NodeA"], ["HostA_ID"], {}],
        # Another simple connection between NodeA and HostA_ServiceX
        [["NodeA"], ["HostA_ServiceX"], {}],
        # A connection between HostA_ServiceX and NodeWithImages.
        # The line_config field specifies the custom styling
        [["HostA_ServiceX"], ["NodeWithImages"], {"line_config": {"thickness": 5, "color": "green"}}],
    ]
}
Currently, the metadata for a host allows the “images” dictionary with the keys
- “icon”: An icon display at the top left of the node, overruling any icon configured in the core
- “emblem”: An image which replaces the blue question mark on nodes, which are not linked to the core.
The metadata for the connections allows the “line_config” dictionary with the keys
- “thickness”: The thickness of the connection
- “color”: The color of the connection. You can use color names, but HEX should also work.
(I’ll probably add some other keys in the next days and will update this accordingly)
Where to put this file?
The base directory of all data is in site directory ~/var/check_mk/topology/data
For each timestamp, create a subfolder in which you store the data file.
The name of the data file must be of a certain format data_{name}.json.
You also need to create a softlink called default that points to the last timestamp so that the visualization knows where to start.
For example, on my site it looks like this
OMD[heute]:~/var/check_mk/topology/data$ ll
total 20
drwxr-xr-x 2 heute heute 4096 Feb 25 15:16 1_Thursday
drwxr-xr-x 2 heute heute 4096 Feb 25 14:17 2_Wednesday
drwxr-xr-x 2 heute heute 4096 Nov  8 10:54 3_Tuesday
drwxr-xr-x 2 heute heute 4096 Nov  8 10:54 4_Monday
drwxr-xr-x 2 heute heute 4096 Nov  8 10:54 5_Sunday
lrwxrwxrwx 1 heute heute   10 Feb 22  2023 default -> 1_Thursday

OMD[heute]:~/var/check_mk/topology/data$ cd default
OMD[heute]:~/var/check_mk/topology/data/default$ ll
total 208
-rw------- 1 heute heute 38893 Feb 25 11:16 data_cdp.json    # this is the file with the data
-rw-rw---- 1 heute heute 69986 Feb 25 11:16 parsed_cdp       # this file is automatically created out of the file above
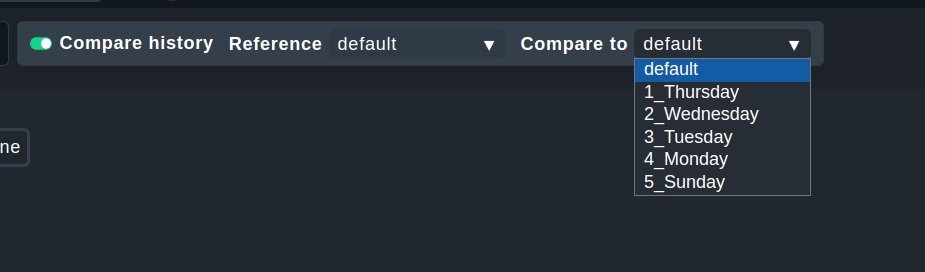
In the GUI it will look like this
Who can help me to generate this data?
Unfortunately nobody at Checkmk at the moment. We do not offer consulting on how to setup all of this. The blog article for this post will be published in a few weeks. Until then, things may still change.
I will check the forum occasionally, but I still have tons of other things to do.
In the meantime you can check out the thread from thl-cmk. He was a great help to me in the development of the feature.
He also has a MKP project that generates LLDP/CDP data files seemingly out of thin air (I’m not a networking guy and don’t understand most of these things)
Furthermore, one of our partners is currently developing a netstat data generator.
I’ll reach out to them next week and ask about the current status.