The important question here is what type of data do you use to generate the topology.
At the moment there are only public available the plugins from @thl-cmk for LLDP and CDP data collection and then creating the topology data with his network visualization data creation plugin.
I already use LLDP and CDP, they work without any problem also I follow this exchange guide steps when I use it. But still I cannot see my all hosts ![]()

What is the output of the data creation plugin?
There you see a number of hosts that the script found in your LLDP/CDP data.
Also can you provide the script execution command you use?
You will only see devices that have CDP/LLDP enabled. These are usually routers and switches but not servers, printers and so on.
Let me guess a little, these 9 hosts are your seed devices?
Have you enabled your HS/SW inventory (Setup → HW/SW inventory rules → Do hardware/software inventory → have a rule that enables HW/SW inventory for your network devices at least)? If you have done that check if the CDP/LLDP plugin finds some information. (Monitor → Inventory → Search CDP neighbours (or Search LLDP neighbours). Only if your HW/SW inventory has found the CDP/LLDP neighbours my network visualization data creation plugin can create the topology data.
As I understand you ask that

Even though the example output shows many more devices, but in my output shows only 1 device I dont know why
On the contrary, I have more devices with CDP/LLDP enabled.
And No, these 9 hosts not seed devices
HW/SW inventory already enabled. And in Search CDP Cache / LLDP Cache I have informations too. Something like that:

is Core01 one of your devices host names as in CMK or is this only from the sample usage? This sould be replaced with your actual seed devices (in most cases your core routers/switches)
Such a screenshot with all the relevant data removed will not help with troubleshooting.
But i think what @thl-cmk already said is the “core” ![]() problem.
problem.
basically useless ![]()
Yes, I try with my Core01 and other seed devices but always I got same result.
Devices added: 1. So If this error is related to the core device, we will be contacting the network team to clarify it.
Also, it had to be this way, unfortunately, I could not disclose company information for information security reasons. ![]() Just wanted to show that LLDP cache information is coming
Just wanted to show that LLDP cache information is coming
OK. You can try to use the --debug option, maybe this will shet some light.
One question, do you have a single CMK site or a distributed environment? If you have a distributed environment try -b MULTISITE please.
3 Likes
HI all,
I try to install the Network Visualization plugin but don’t work.
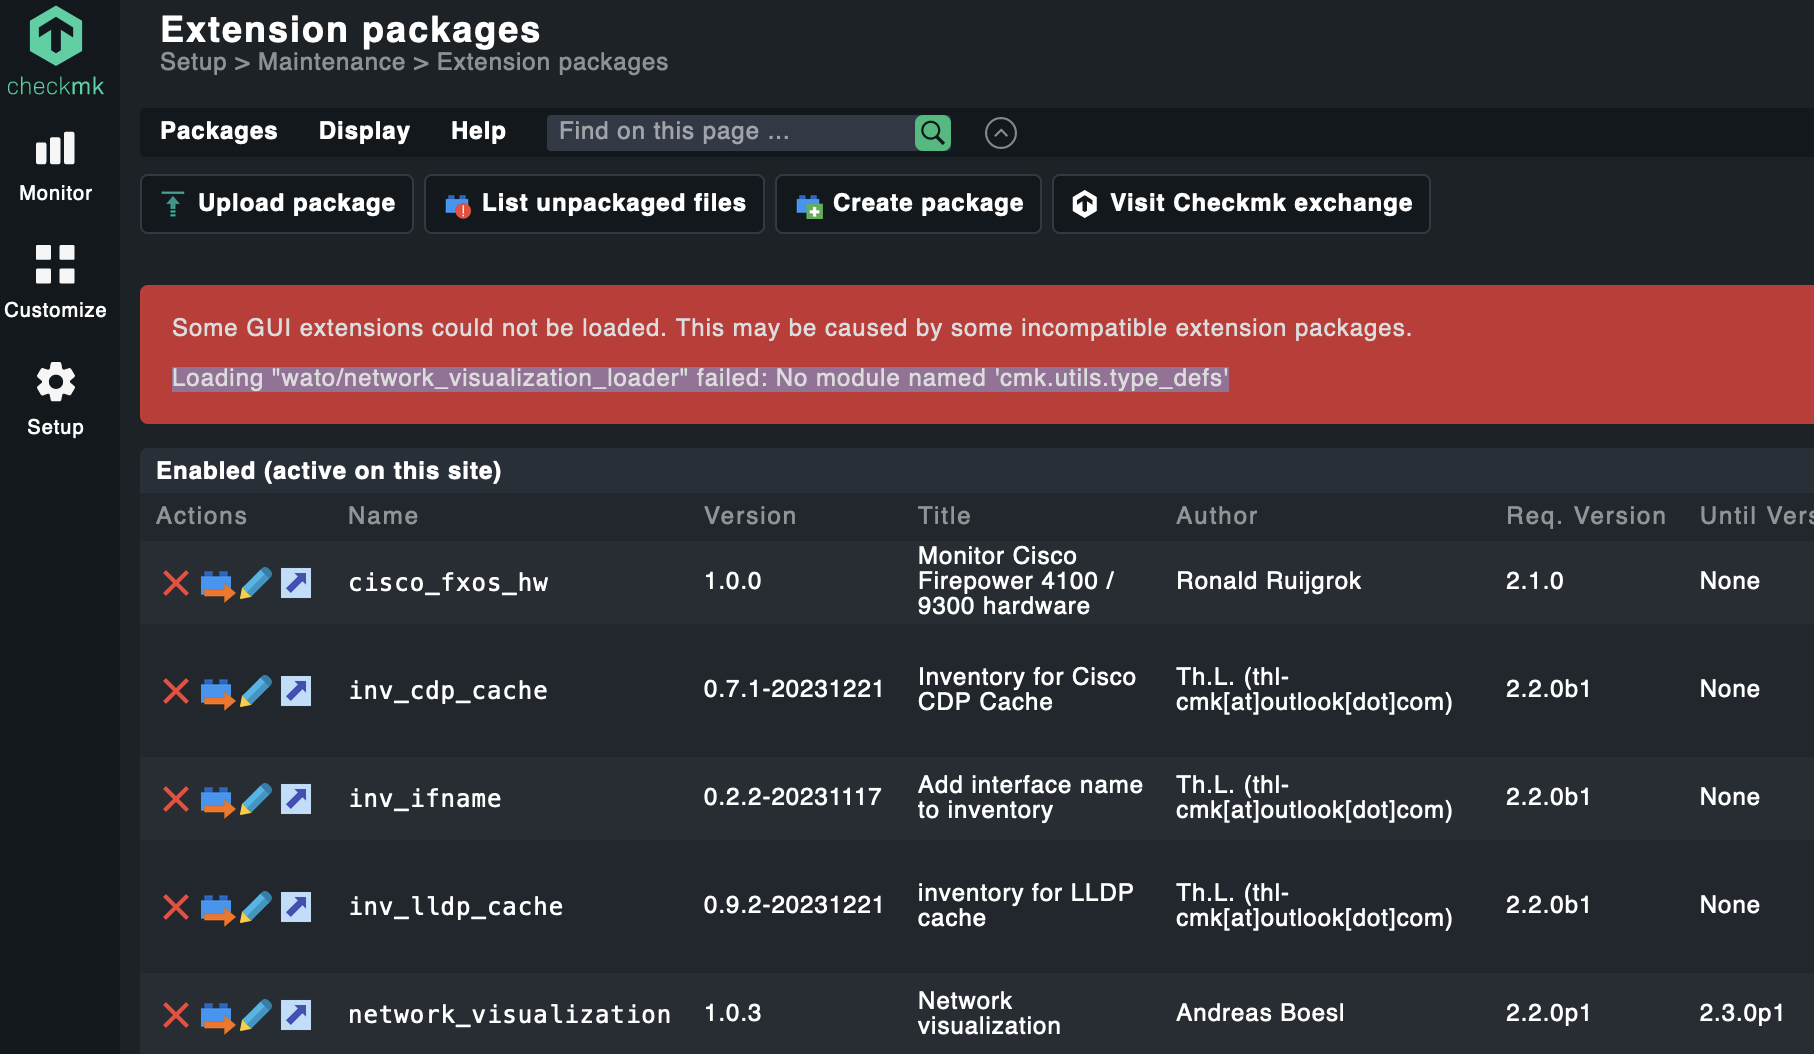
This extension don’t enable and I see this error on my Checkmk installation
Some GUI extensions could not be loaded. This may be caused by some incompatible extension packages.
Loading “wato/network_visualization_loader” failed: No module named ‘cmk.utils.type_defs’
I install all module required for this plugin as reported on:
https://exchange.checkmk.com/p/create-topology-data
Best Regards
Fabio
I try to the last stable release and with 2.3 releases in msp edition.
with CMK 2.3, there is no need to install the Network visualization plugin fom the exchange, this is already included. You only need to install the inventory plugins and my Network Visualization data creation tool to create the topology data.
Hi
I user the installation Guide in your link plugin.
After I use the command
~/local/bin/nvdct/nvdct.py -s DEVICE-CORE -d -l CDP STATIC --keep 10 --min-age 14 --log-to-stdout
The script ended without a problem but on the CheckMK GUI I don’t show the network topology in the monitor menù.
You can explain as I enable the visualization of the topology?
Best Regards
CMK 2.3 you need to add --new-format to the command.
If this doesn’t help, can you post the CLI output here (without the --log-to-stdout option)?
Hi
I connect to the the specific site with “omd su” command and I start with this command:
/local/bin/nvdct/nvdct.py -s XXXXXX-FO-SW01 -d -l CDP STATIC --keep 10 --min-age 14 --log-to-stdout --new-format
I copy the end of the output:
2024-04-17 09:36:01,107 :: WARNING :: nvdct :: get_service_by_interface() :: 290 :: Device: 01: service for interface eno1 not found
2024-04-17 09:36:01,109 :: WARNING :: nvdct :: get_service_by_interface() :: 290 :: Device: XXXXXX-FO-SW04: service for interface Gi1/16 not found
2024-04-17 09:36:01,109 :: WARNING :: nvdct :: create_device_from_inv() :: 339 :: service not found: host: XXXXXX-FO-SW04, raw_local_port: Gi1/16
2024-04-17 09:36:01,110 :: WARNING :: nvdct_classes :: host_exists() :: 642 :: [MULTISITE] Host GC-AP10-XXXXXX not found in CMK
2024-04-17 09:36:01,110 :: WARNING :: nvdct :: get_service_by_interface() :: 290 :: Device: GC-AP10-XXXXXX: service for interface Gi0 not found
2024-04-17 09:36:01,110 :: WARNING :: nvdct :: create_device_from_inv() :: 348 :: service not found: neighbour: GC-AP10-XXXXXX, raw_neighbour_port: Gi0
2024-04-17 09:36:01,110 :: WARNING :: nvdct :: get_service_by_interface() :: 290 :: Device: XXXXXX-FO-SW04: service for interface Gi1/16 not found
2024-04-17 09:36:01,110 :: WARNING :: nvdct :: get_service_by_interface() :: 290 :: Device: GC-AP10-XXXXXX: service for interface Gi0 not found
Devices added: 57, source cdp
Devices added: 0, source STATIC
Time taken…: 0.290586108/s
End time…: 2024-04-17T09:36:01.04
After the script finish I don’t see any “Network Topology” menù in the Checkmk GUI.
Is not clear as I show the topology in the new format.
Best Regards
Fabio
Hi Fabio,
if the data for the visualization is setup correctly, you will see an extra option here at the context menu for the hosts.
Right now, I’m not sure if there is a “Network Topology” link the in Checkmk GUI.

1 Like
Hi
I see the new option.
The Guide is not clear. If I follow the guide is not clear as I see the Network Topology menù.
Best Regards
Fabio