keep in mind that 2.3 is still in Beta, and the “latest” documentation is for version 2.2.
Our knowledge team is working hard on getting the entire documentation updated for the release date. Take a look here to see if this topic is already done: https://docs.checkmk.com/2.3.0-beta/en/index.html
Hello Guys,
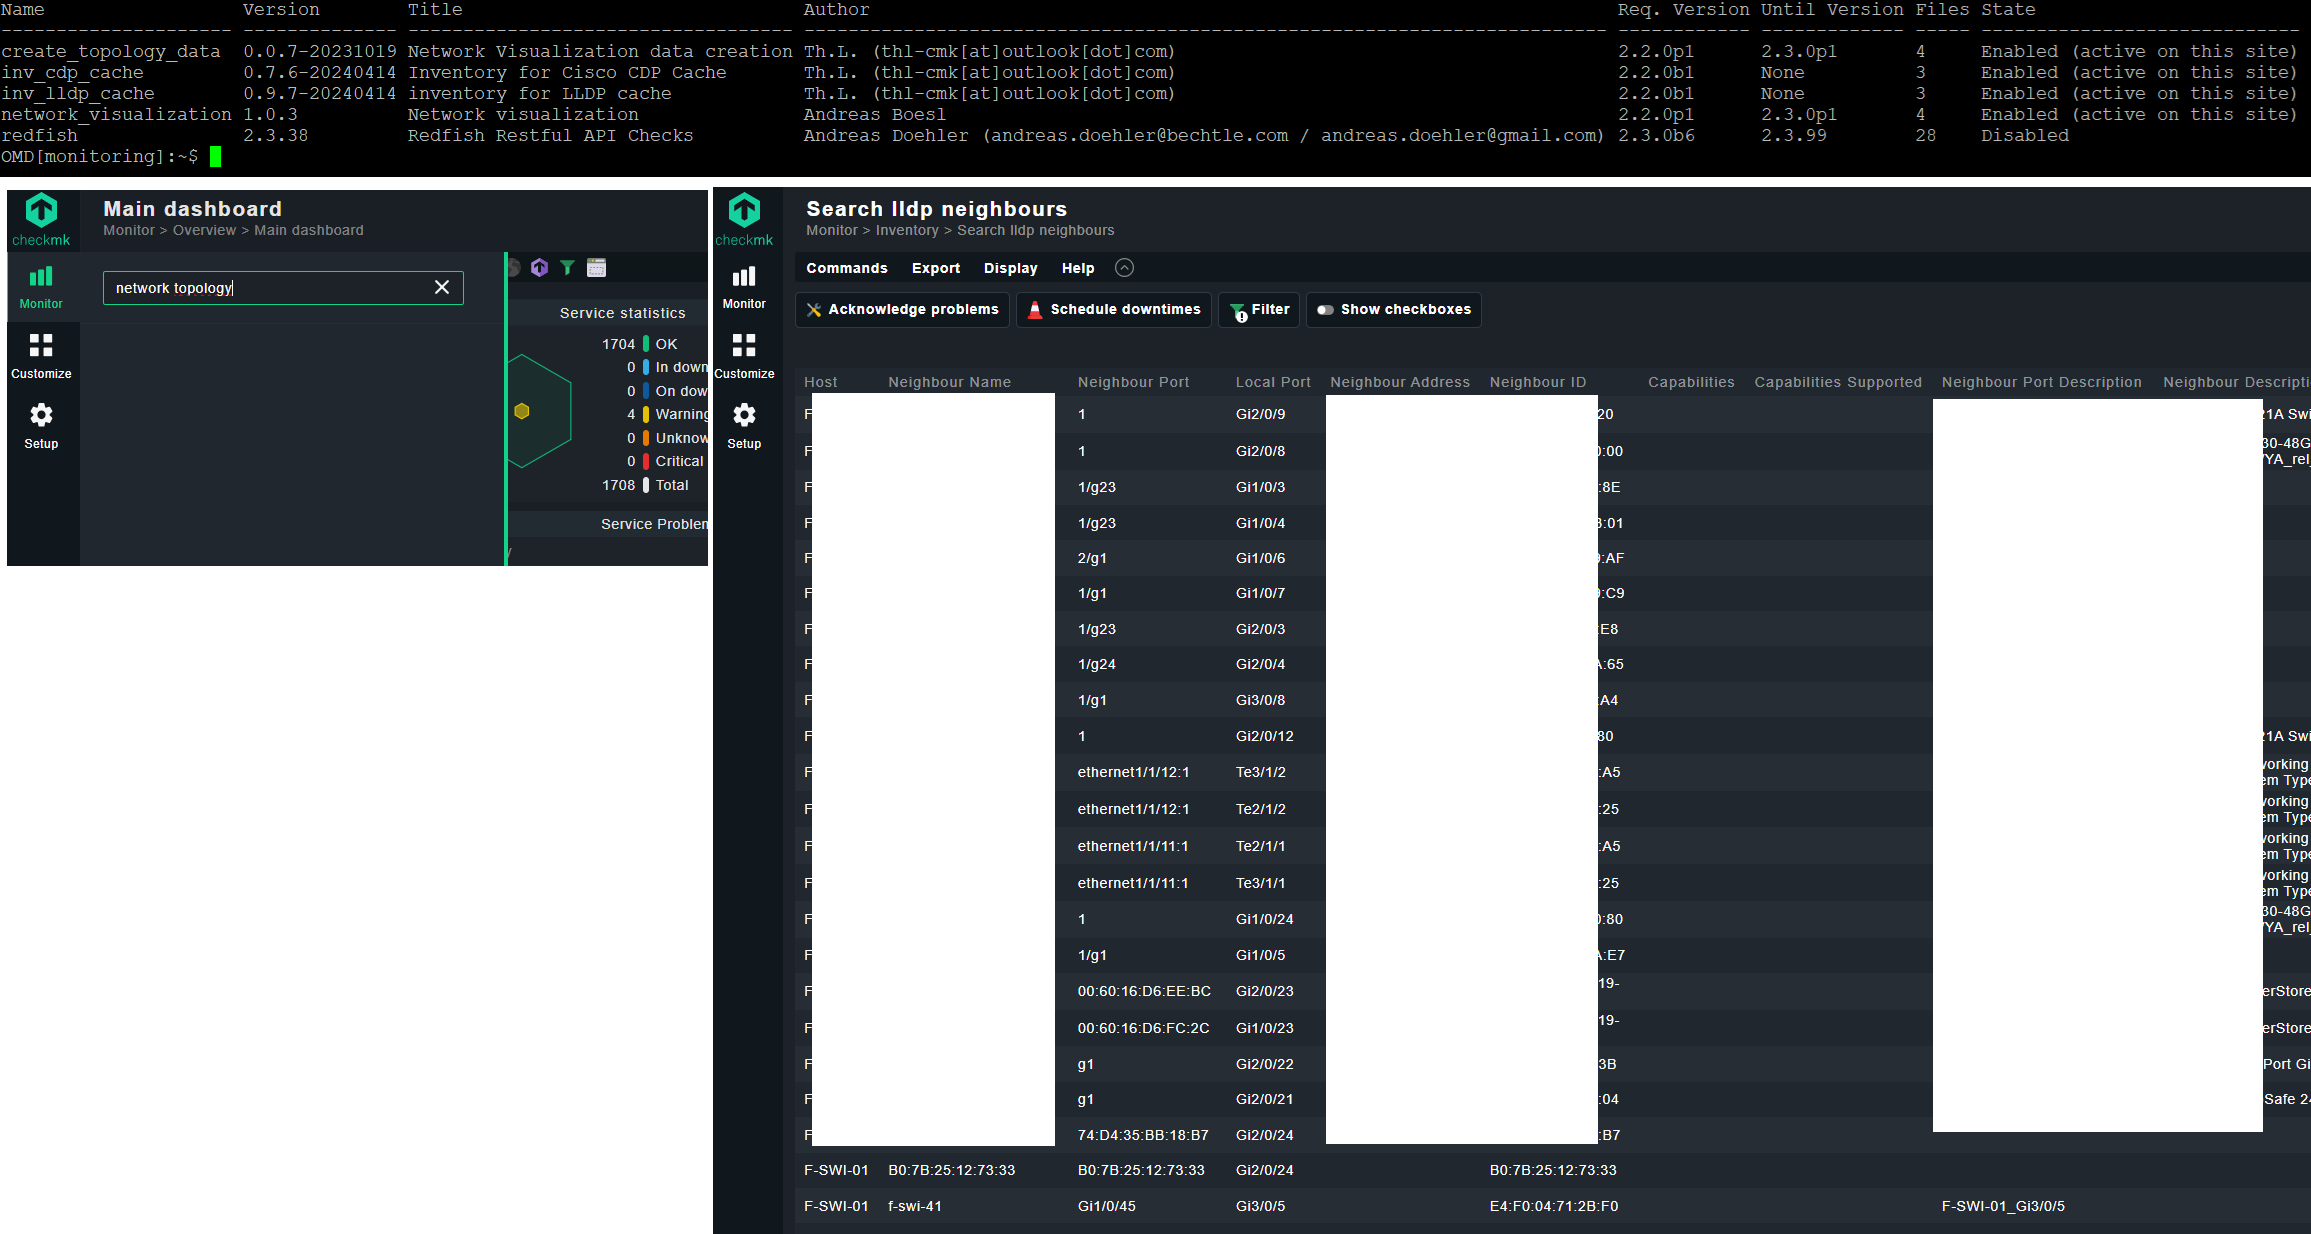
I saw your topic and installed all the needed plugins I think. I also can see all the lldp neighbours on Monitoring → Inventory → Search lldp neighbours.
My problem is, there is no Network Topology menu. I just can’t find it.
Maybe a problem of checkmk raw version? Can someone help me find my misstake? I’m using Checkmk Raw Edition 2.3.0 on Ubuntu 22.04 lts . Attached I provided some screenshots.
This “Network topology” icon is only shown if there is data available in the topology directory.
For example ~/var/check_mk/topology/data/default/data_lldp.json
    def render(self, what, row, tags, custom_vars):
        # Only show this icon if topology data is available
        files = glob.glob("data_*.json", root_dir=topology_data_dir / "default")
        if not files:
            return None
We still have to provide some (way more…) documentation for this hidden feature.
I hope this will happen within the next weeks.
Have you executed as site user the script included in the package “create_topology_data”?
You can find it under “~/local/bin/…”
This script creates the json file needed for visualization.
Also i think your “create_topology_data” plugin is not suitable for CMK 2.3, the same is for the “network_visualization” @thl-cmk already gave some hints what is needed for CMK 2.3
here
I have finally got some time to play around with this in my homelab with just a few juniper switches and a firewall all talking LLDP (I have also added the IPv4 module and the interface extension)
Things have been working fine, the HW/SW inventory looks ok and the maps are generated ok as well.
However I just moved one of the switches from one site to another site (poller) and now things are not working. I did a new inventory LLDP is not working, the map is empty. When I now look at the other switch the moved to another poller is removed from the path as well.
However when running the nvdct command it is successful and it adds the LLDP sources.
Is the intention that all hosts needs to be monitored from the same site? In our case thats not possible (1000+ switches)
In addition to the above it would be nice if:
The pop-over could stay, I would like to perhaps click on the host in the popup
Can I customise what fields to show in the pop-up? For example we have custom actions that goes to our CMDB and enable SSH etc. directly from views, would like to have that here as well.
It would also be nice when towering over a router to show the routing engine CPU usage etc. Or if I hower over an interface to see the bandwidth and things like error rate.
This might be overkill but it would be nice if the parent info could be populated. I know its not possible today as a parent host needs to be monitored on the same site (and that does not work for us due to our size)
No, this is not intended. As long as the NVDCT runs on the main site you should be fine. It will automatically detect the remote sites and retrive the data from there. You can check the logfile to see which sites are found.
By default NVDCT uses the CMK livestatus python package (MULTISITE backend).
Here a sample
~/local/bin/nvdct/nvdct.py --log-level INFO
2024-06-08 16:37:43,171 :: INFO :: nvdct :: <module>() :: 1072 :: Data creation started
2024-06-08 16:37:43,173 :: INFO :: backends :: get_sites() :: 376 :: [MULTISITE] Site central found, Socket: unix:/omd/sites/central/tmp/run/live, TLS: N/A.
2024-06-08 16:37:43,173 :: INFO :: backends :: get_sites() :: 376 :: [MULTISITE] Site remote1 found, Socket: tcp:remote1.test.test:6557, TLS: ('encrypted', {'verify': True}).
2024-06-08 16:37:43,174 :: INFO :: backends :: __init__() :: 335 :: [MULTISITE] Create livestatus connection(s)
2024-06-08 16:37:43,291 :: INFO :: backends :: __init__() :: 99 :: init HOST_CACHE
This sould also work with the RESTAPI backend where CMK fetches the data from the remote sites.
The LIVESTATUS backend is only for single sites.
2024-06-08 16:45:20,804 :: WARNING :: backends :: host_exists() :: 291 :: [LIVESTATUS] Host HOST01 not found in CMK
Thanks, I think I’ve read that MULTISITE was used instead of livestatus, so it should work.
As a last resource I moved the switch to the main site LLDP started to work again, but whatever I did I couldn’t get L3v4 discovery working. I just gave up, deleted the host, adding it again and … well everything is now working again…
An earlier version of the visualisation made it possible to fix the pop-up menu with one click. It was also possible to fix several popups at once. I removed it again because the screen displayed too much information at a certain stage. So right now, you can only access the host/service information via this context action
Regarding the parent information. Are you referring to the ‘Parents/Children’ field in the monitoring core? If the parent/child reside on the same server, you can simply add this field to the topology_hover_* view.
If they are located on different monitoring servers, you have to obtain this information ‘somehow’ differently.
But once this info is available on the central site, it is quite easy to write a custom painter for this info and add it to the existing views.
Thanks. did not know these where normal views. I have managed to get some icons added to our CMDB and SSH just for testing (but as I cant click on them, would be really useful if that was possible) I assume this lies with Checkmk now as the NW visualisation is builtin in 2.3?
It would be really helpful to show graphs as well, but as they are based on normal host/servide views thats not possible, I guess?
Not sure where this is stored. We did copy piggyback hosts data preciously as it was assumed the host who have piggybacked “hosts” are monitored from the same site.
I dont think I want to modify hosts.mk or anything like that, its to scary in larger installations…
just for transparency, the issue was unexpected data in the IP-Address inventory from a host monitored via CMK-agent and SNMP. Lines with unexpected data will now be dropped. You can look for such lines in the log file
2024-06-18 09:56:59,384 :: WARNING :: nvdct :: create_l3v4_topology() :: 545 :: Drop IPv4 address data for host: <YOU-HOST-NAME>, data: {'device': 'lo', 'address': '127.0.0.1', 'type': 'ipv4'}
thanks for all that great work. Just started to play around and it’s working amazing.
I’m just wondering if there is a possibility to change the default filter for topology mesh depth?