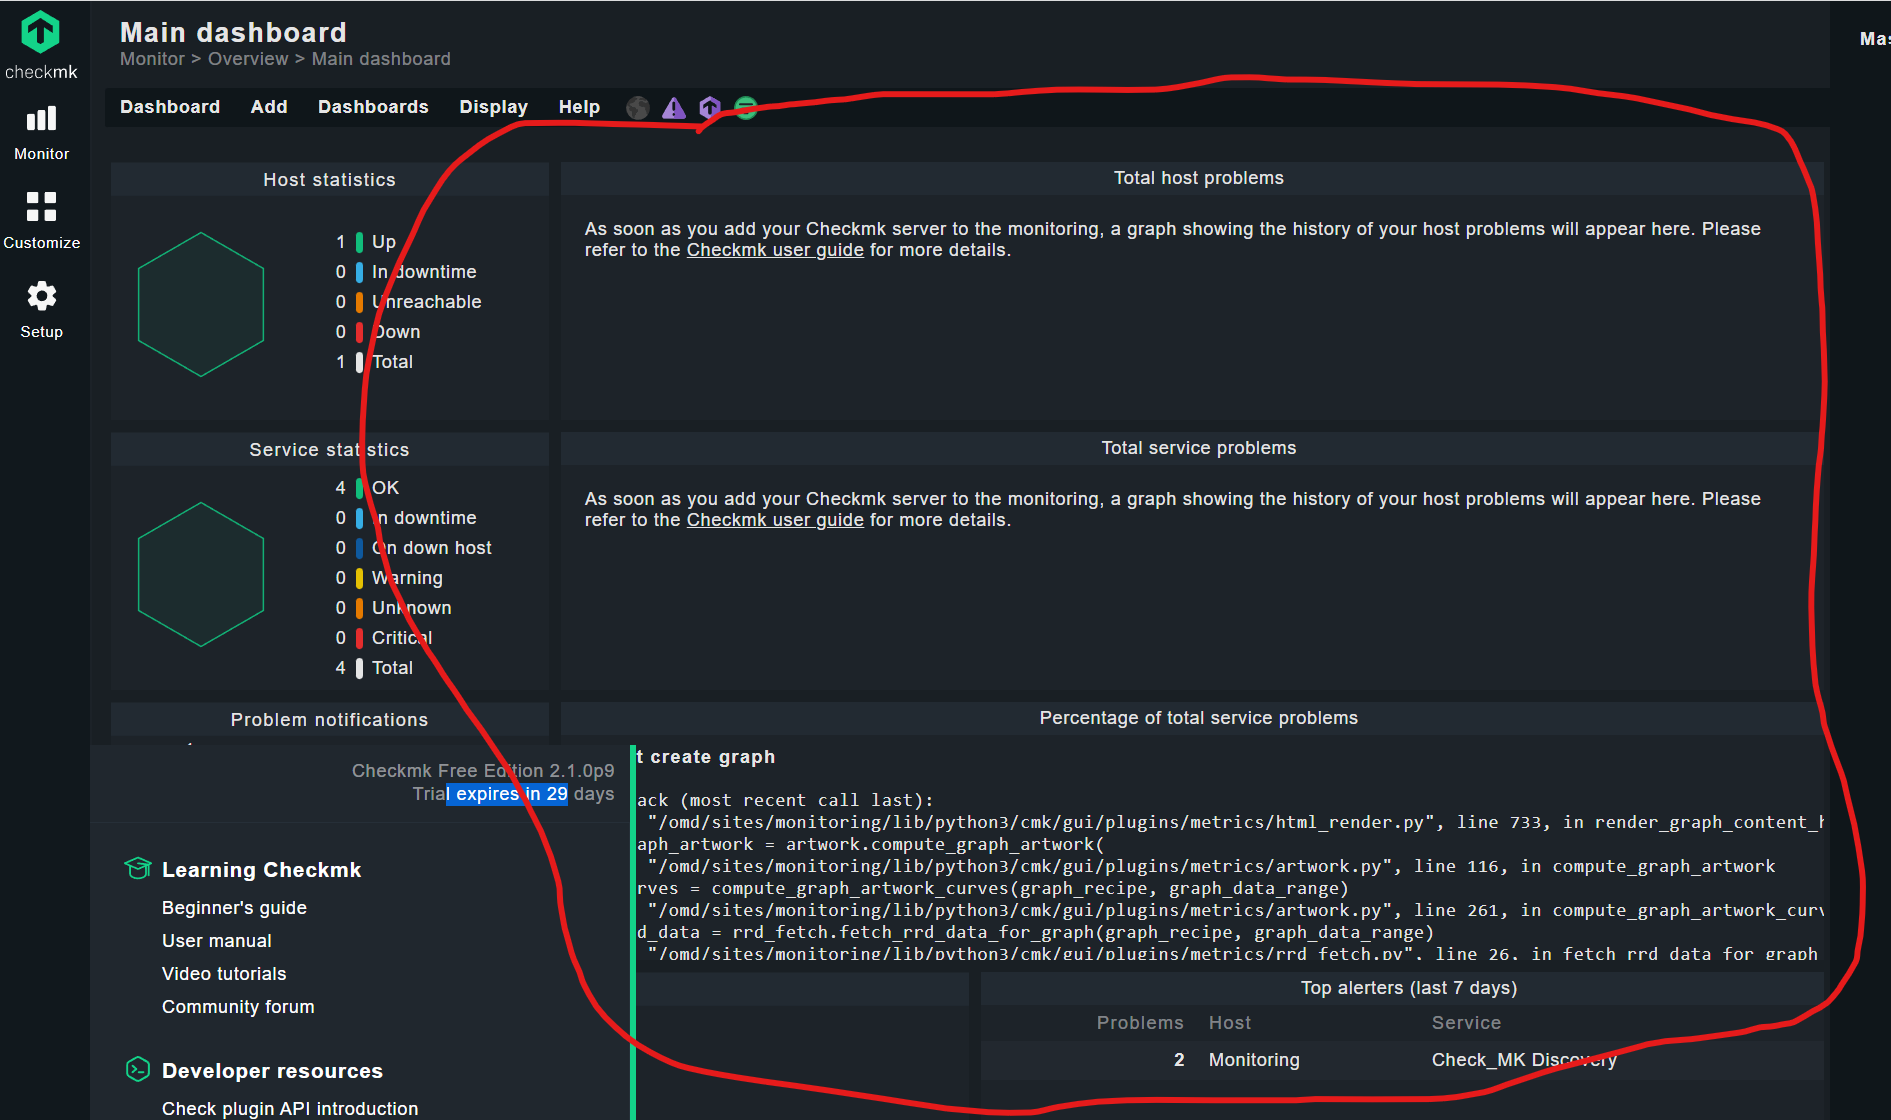
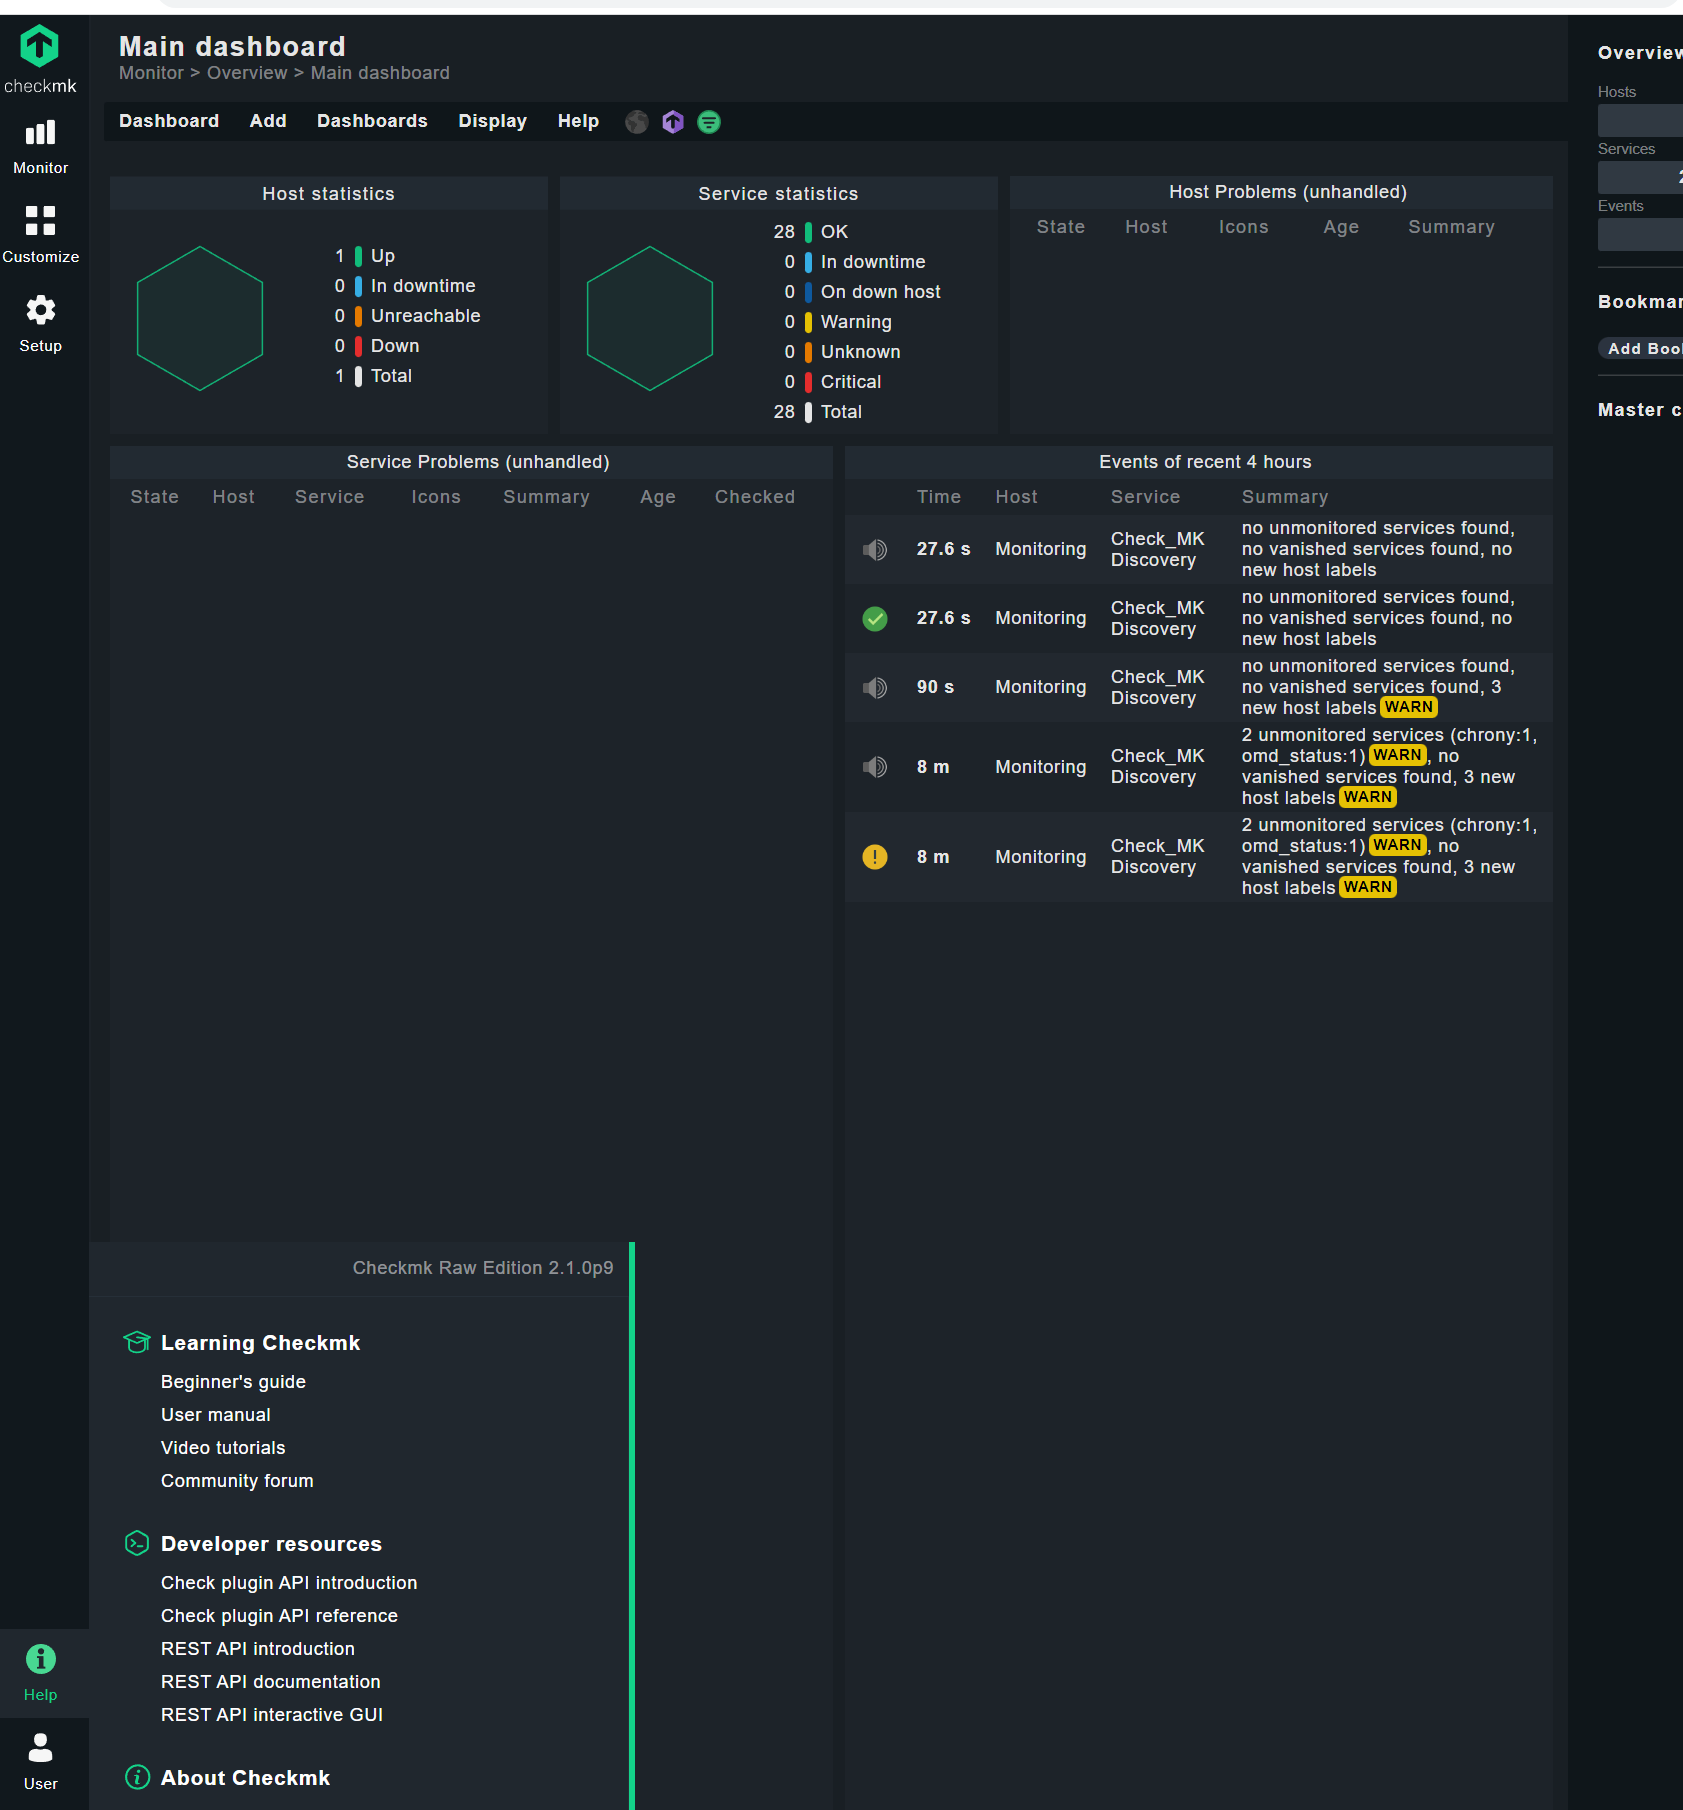
The WebUI does not seem to connect back to it self correctly? On new install it should be self aware? I check the guilds and this is standalone so, check that the config is present and not sure what else may be needed.
Output of “cmk --debug -vvn hostname”: (If it is a problem with checks or plugins)
OMD[monitoring]:~$ cmk --debug -vvn 127.0.0.1
Checkmk version 2.1.0p9
Try license usage history update.
Trying to acquire lock on /omd/sites/monitoring/var/check_mk/license_usage/next_run
Got lock on /omd/sites/monitoring/var/check_mk/license_usage/next_run
Trying to acquire lock on /omd/sites/monitoring/var/check_mk/license_usage/history.json
Got lock on /omd/sites/monitoring/var/check_mk/license_usage/history.json
Next run time has not been reached yet. Abort.
Releasing lock on /omd/sites/monitoring/var/check_mk/license_usage/history.json
Released lock on /omd/sites/monitoring/var/check_mk/license_usage/history.json
Releasing lock on /omd/sites/monitoring/var/check_mk/license_usage/next_run
Released lock on /omd/sites/monitoring/var/check_mk/license_usage/next_run
+ FETCHING DATA
  Source: SourceType.HOST/FetcherType.PIGGYBACK
[cpu_tracking] Start [7faefb7e7f40]
[PiggybackFetcher] Fetch with cache settings: NoCache(127.0.0.1, base_path=/omd/sites/monitoring/tmp/check_mk/data_source_cache/piggyback, max_age=MaxAge(checking=0, discovery=120, inventory=120), disabled=True, use_outdated=False, simulation=False)
Not using cache (Cache usage disabled)
[PiggybackFetcher] Execute data source
No piggyback files for '127.0.0.1'. Skip processing.
No piggyback files for '127.0.0.1'. Skip processing.
Not using cache (Cache usage disabled)
[cpu_tracking] Stop [7faefb7e7f40 - Snapshot(process=posix.times_result(user=0.0, system=0.0, children_user=0.0, children_system=0.0, elapsed=0.0))]
+ PARSE FETCHER RESULTS
  Source: SourceType.HOST/FetcherType.PIGGYBACK
No persisted sections
  -> Add sections: []
Received no piggyback data
[cpu_tracking] Start [7faefb7a9a90]
value store: synchronizing
Trying to acquire lock on /omd/sites/monitoring/tmp/check_mk/counters/127.0.0.1
Got lock on /omd/sites/monitoring/tmp/check_mk/counters/127.0.0.1
value store: loading from disk
Releasing lock on /omd/sites/monitoring/tmp/check_mk/counters/127.0.0.1
Released lock on /omd/sites/monitoring/tmp/check_mk/counters/127.0.0.1
No piggyback files for '127.0.0.1'. Skip processing.
No piggyback files for '127.0.0.1'. Skip processing.
[cpu_tracking] Stop [7faefb7a9a90 - Snapshot(process=posix.times_result(user=0.0, system=0.0, children_user=0.0, children_system=0.0, elapsed=0.010000000707805157))]
execution time 0.0 sec | execution_time=0.010 user_time=0.000 system_time=0.000 children_user_time=0.000 children_system_time=0.000 cmk_time_agent=0.000
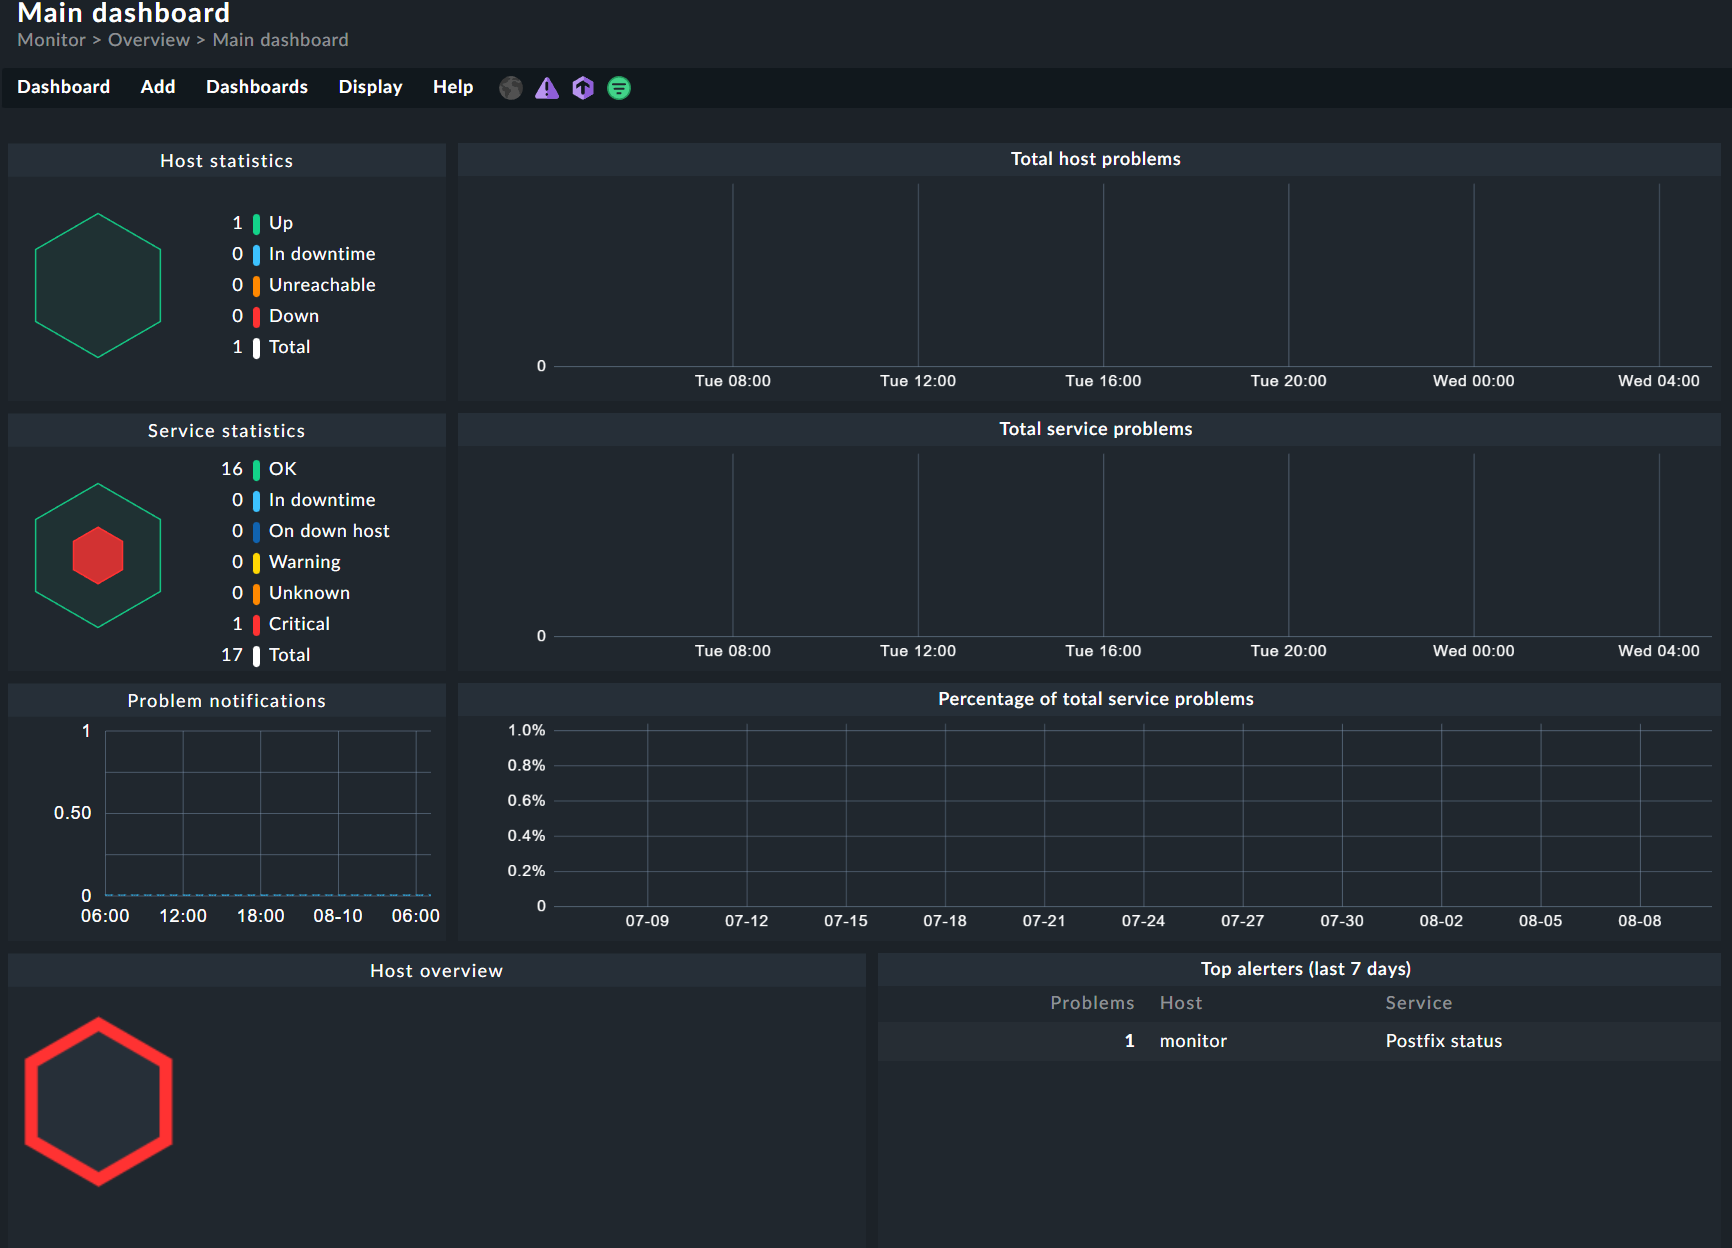
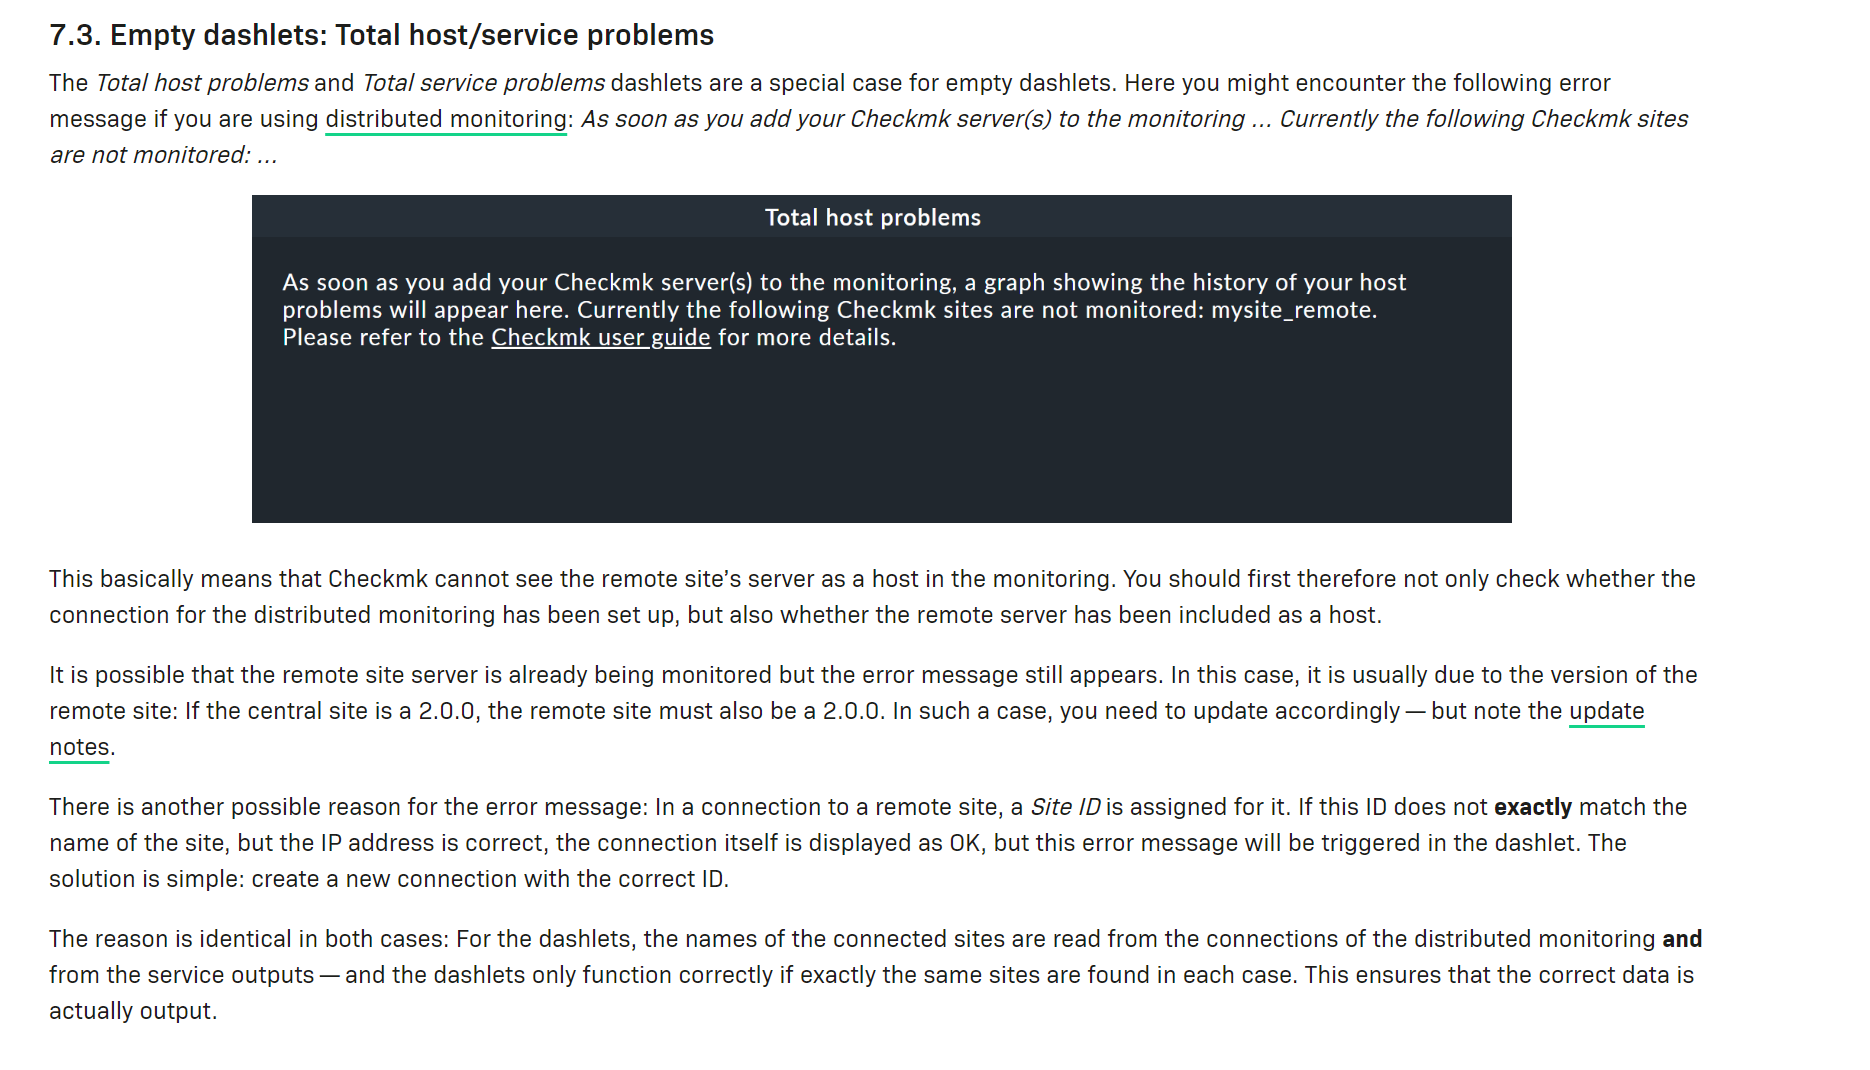
You need to add the monitoring server itself to the monitoring. Then you should see something in the mentioned areas.
Don’t forget to also activate the HW/SW inventory with the needed plugins deployed.
Interesting, I whiped everything ( format / re-install of cent os …
[root@monitoring ~]# wget https://download.checkmk.com/checkmk/2.1.0p9/check-mk-raw-2.1.0p9-el7-38.x86_64.rpm

--2022-08-18 00:11:49--  https://download.checkmk.com/checkmk/2.1.0p9/check-mk-raw-2.1.0p9-el7-38.x86_64.rpm

Resolving download.checkmk.com (download.checkmk.com)... 45.133.11.29
Connecting to download.checkmk.com (download.checkmk.com)|45.133.11.29|:443... connected.
HTTP request sent, awaiting response... 200 OK
Length: 174752988 (167M) [application/x-redhat-package-manager]
Saving to: ‘check-mk-raw-2.1.0p9-el7-38.x86_64.rpm’

100%[===========================================================>] 174,752,988 23.0MB/s   in 8.0s

2022-08-18 00:11:58 (20.8 MB/s) - ‘check-mk-raw-2.1.0p9-el7-38.x86_64.rpm’ saved [174752988/174752988]


[root@monitoring ~]# sha256sum check-mk-raw-2.1.0p9-el7-38.x86_64.rpm
bd5953e9e95fa295bc9b17f031b753fdb7167d282ac0444632351dc091fcde69  check-mk-raw-2.1.0p9-el7-38.x86_64.rpm


[root@monitoring ~]# sudo rpm --install ./check-mk-raw-2.1.0p9-el7-38.x86_64.rpm
warning: ./check-mk-raw-2.1.0p9-el7-38.x86_64.rpm: Header V4 RSA/SHA512 Signature, key ID c4503261: NOKEY
error: Failed dependencies:
        time is needed by check-mk-raw-2.1.0p9-el7-38.x86_64
        traceroute is needed by check-mk-raw-2.1.0p9-el7-38.x86_64
        dialog is needed by check-mk-raw-2.1.0p9-el7-38.x86_64
        graphviz is needed by check-mk-raw-2.1.0p9-el7-38.x86_64
        graphviz-gd is needed by check-mk-raw-2.1.0p9-el7-38.x86_64
        httpd is needed by check-mk-raw-2.1.0p9-el7-38.x86_64
        libevent is needed by check-mk-raw-2.1.0p9-el7-38.x86_64
        libdbi is needed by check-mk-raw-2.1.0p9-el7-38.x86_64
        libtool-ltdl is needed by check-mk-raw-2.1.0p9-el7-38.x86_64
        rpcbind is needed by check-mk-raw-2.1.0p9-el7-38.x86_64
        pango is needed by check-mk-raw-2.1.0p9-el7-38.x86_64
        perl-Locale-Maketext-Simple is needed by check-mk-raw-2.1.0p9-el7-38.x86_64
        perl-IO-Zlib is needed by check-mk-raw-2.1.0p9-el7-38.x86_64
        php is needed by check-mk-raw-2.1.0p9-el7-38.x86_64
        php-cli is needed by check-mk-raw-2.1.0p9-el7-38.x86_64
        php-xml is needed by check-mk-raw-2.1.0p9-el7-38.x86_64
        php-mbstring is needed by check-mk-raw-2.1.0p9-el7-38.x86_64
        php-pdo is needed by check-mk-raw-2.1.0p9-el7-38.x86_64
        php-gd is needed by check-mk-raw-2.1.0p9-el7-38.x86_64
        rsync is needed by check-mk-raw-2.1.0p9-el7-38.x86_64
        uuid is needed by check-mk-raw-2.1.0p9-el7-38.x86_64
        xinetd is needed by check-mk-raw-2.1.0p9-el7-38.x86_64
        freeradius-utils is needed by check-mk-raw-2.1.0p9-el7-38.x86_64
        libpcap is needed by check-mk-raw-2.1.0p9-el7-38.x86_64
        bind-utils is needed by check-mk-raw-2.1.0p9-el7-38.x86_64
        poppler-utils is needed by check-mk-raw-2.1.0p9-el7-38.x86_64
        libgsf is needed by check-mk-raw-2.1.0p9-el7-38.x86_64
        rpm-build is needed by check-mk-raw-2.1.0p9-el7-38.x86_64
        postgresql-libs is needed by check-mk-raw-2.1.0p9-el7-38.x86_64
[root@monitoring ~]#
Seems the basic installation steps and documentation could use an update for CentOS
Using “yum” to install the RPM and find dependencies works fine. … as long as the RPM correctly specifies all the dependencies needed.
[root@monitoring ~]# omd create monitoring
Adding /opt/omd/sites/monitoring/tmp to /etc/fstab.
Creating temporary filesystem /omd/sites/monitoring/tmp...OK
Updating core configuration...
Generating configuration for core (type nagios)...
Precompiling host checks...OK
Executing post-create script "01_create-sample-config.py"...OK
Restarting Apache...OK
Created new site monitoring with version 2.1.0p9.cre.

  The site can be started with omd start monitoring.
  The default web UI is available at http://monitoring/monitoring/

  The admin user for the web applications is cmkadmin with password:
  For command line administration of the site, log in with 'omd su monitoring'.
  After logging in, you can change the password for cmkadmin with 'htpasswd etc/htpasswd cmkadmin'.
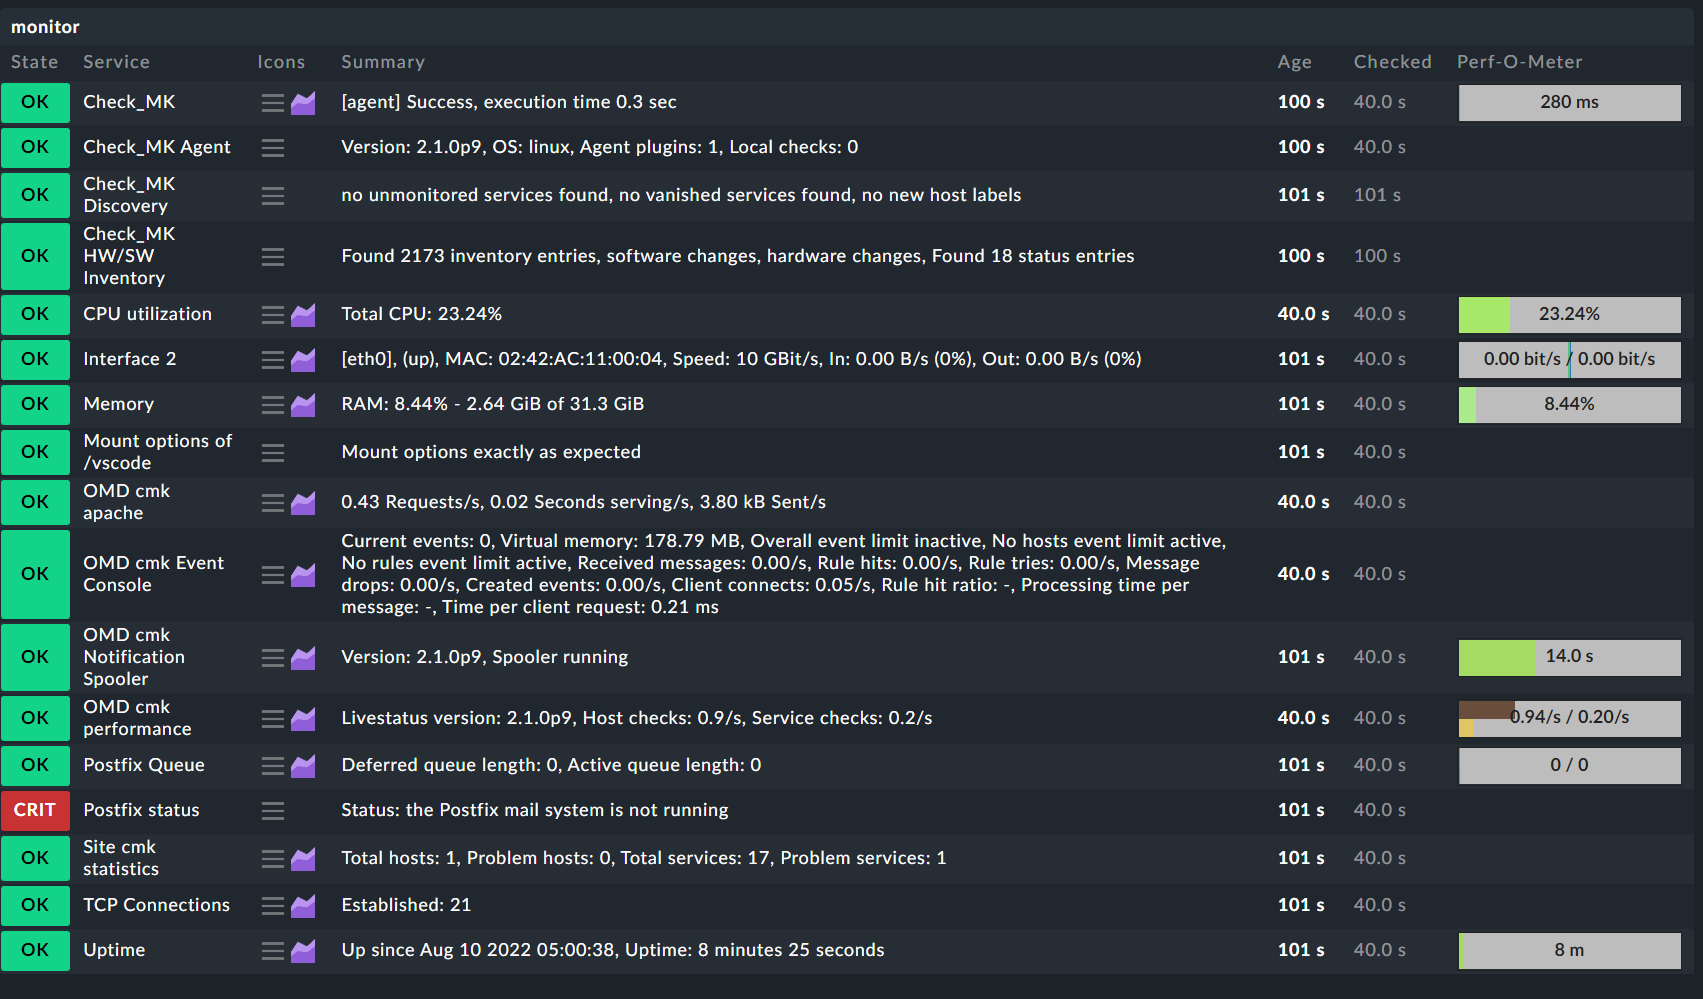
I just have to say: Your only problem was, that you did not monitor the Checkmk server itself properly.
Everything else was working fine, you just missed that one simple step.
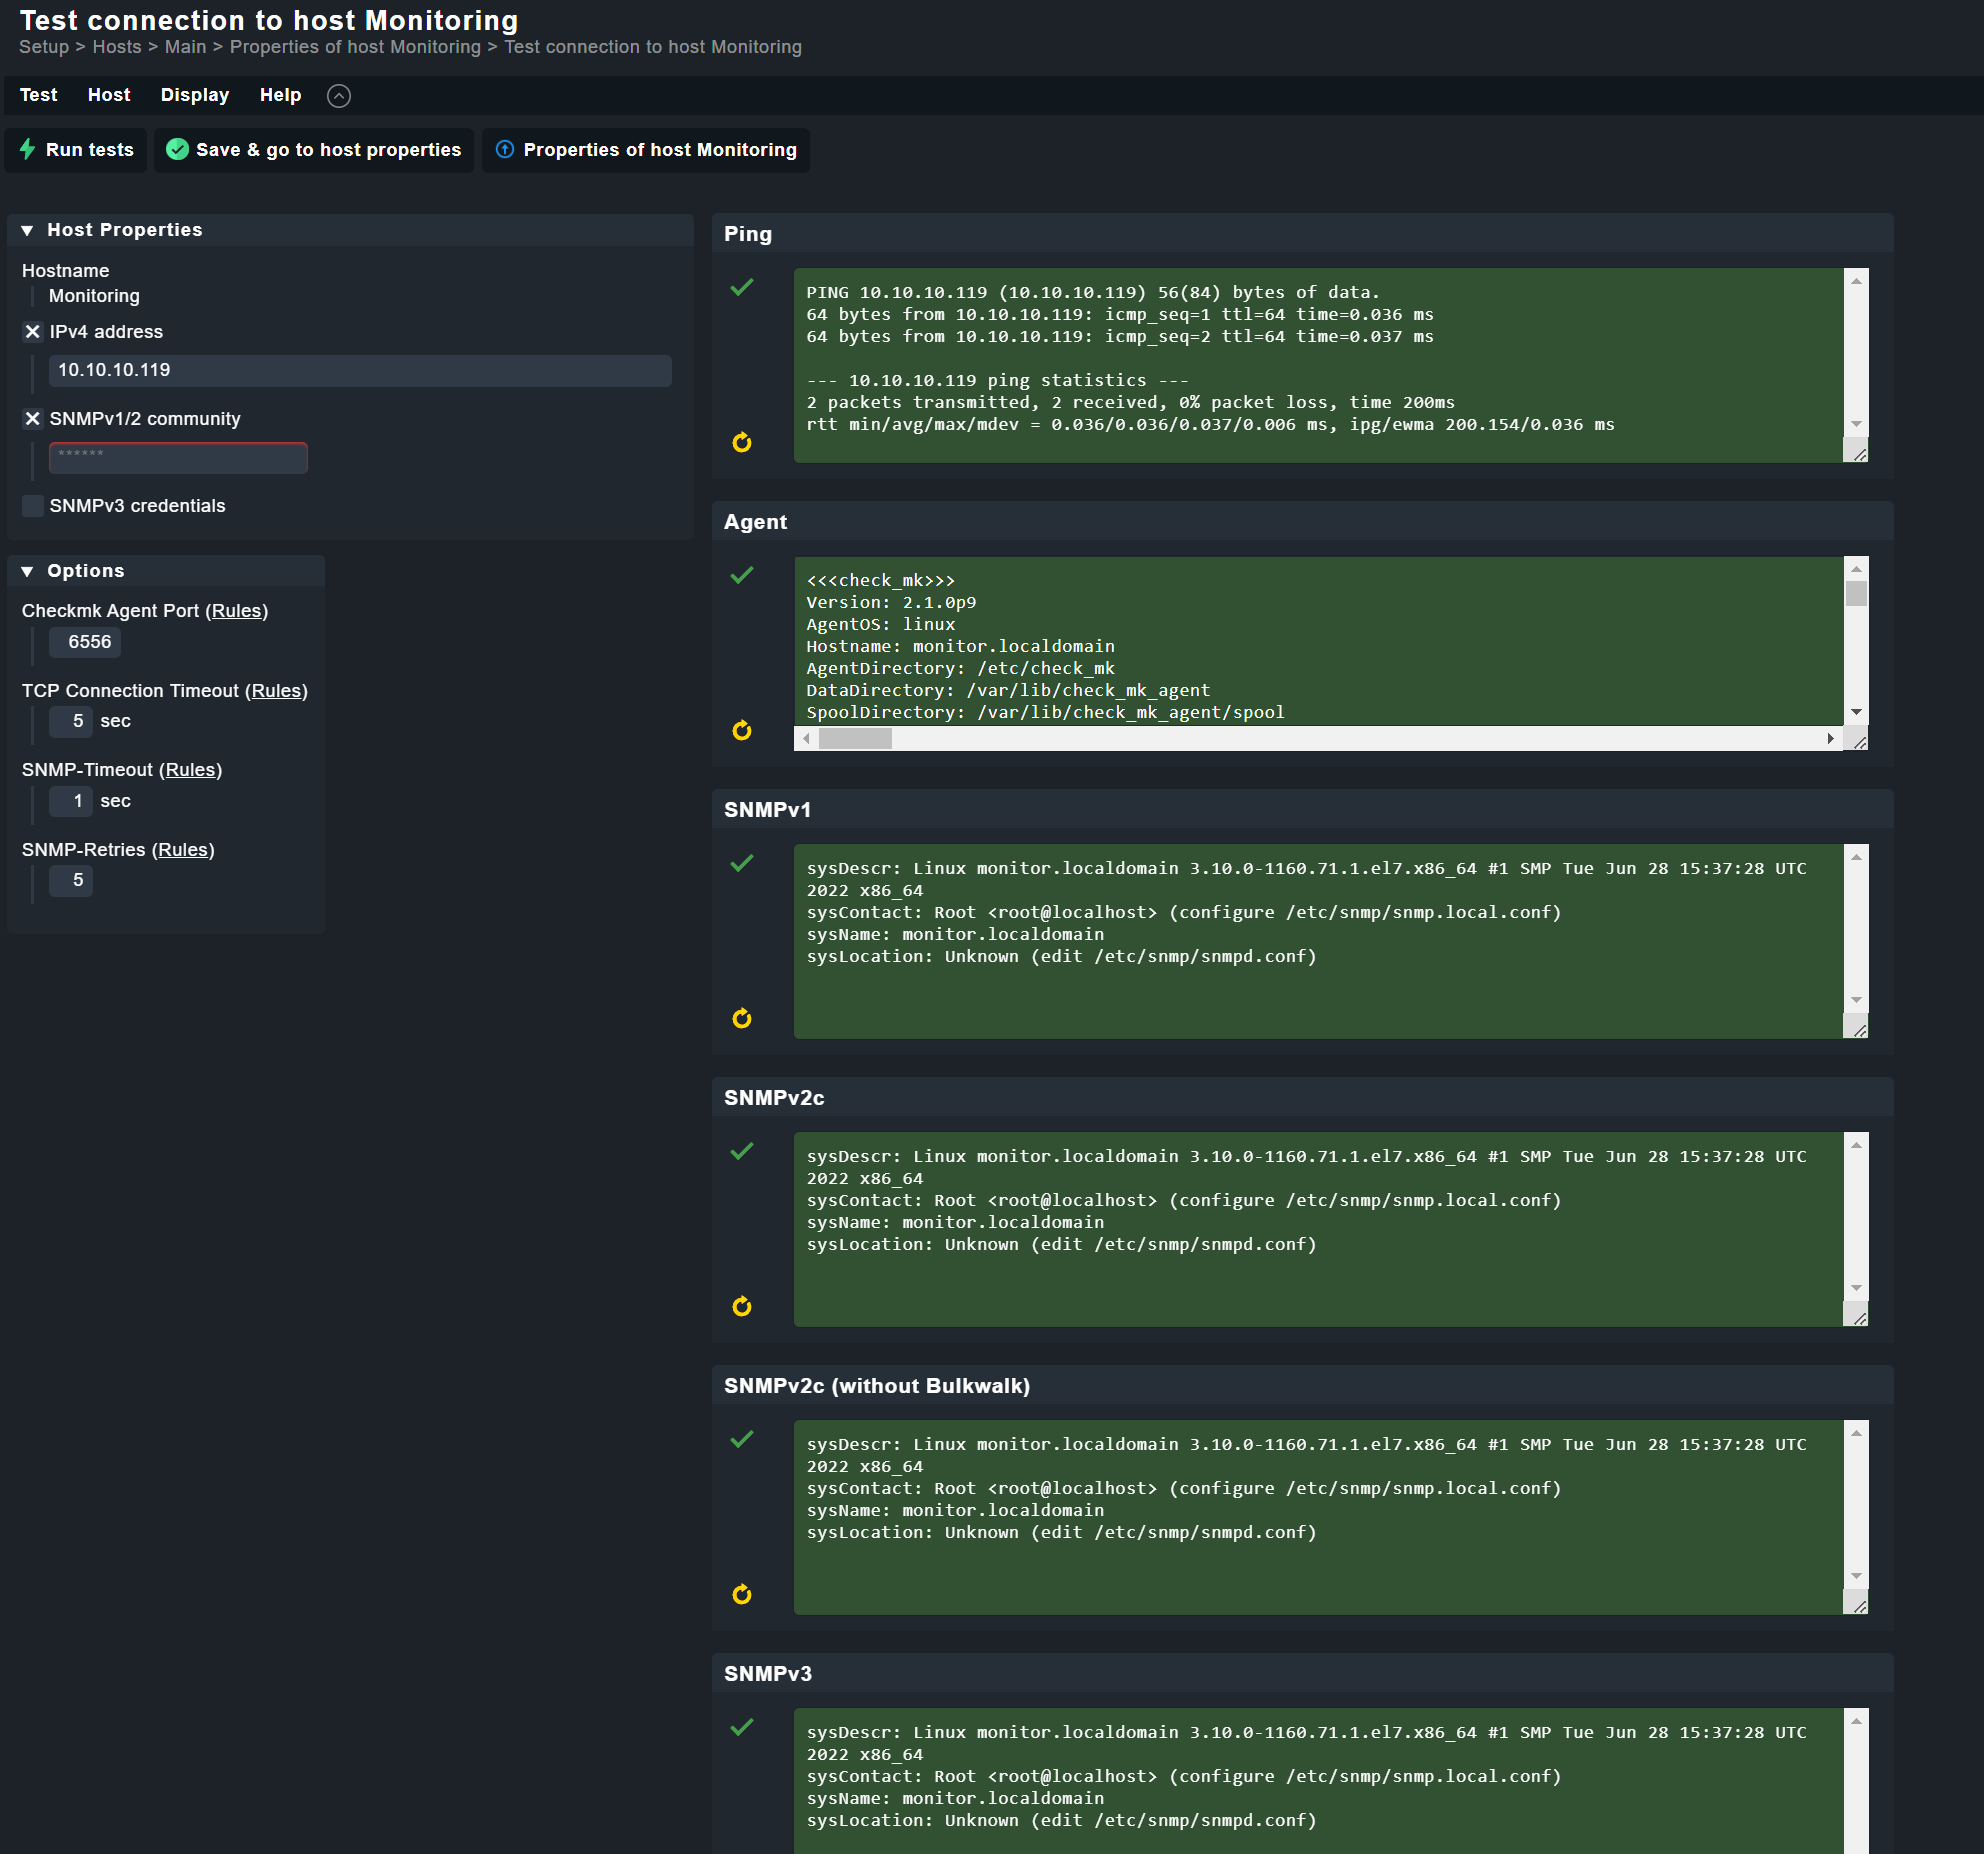
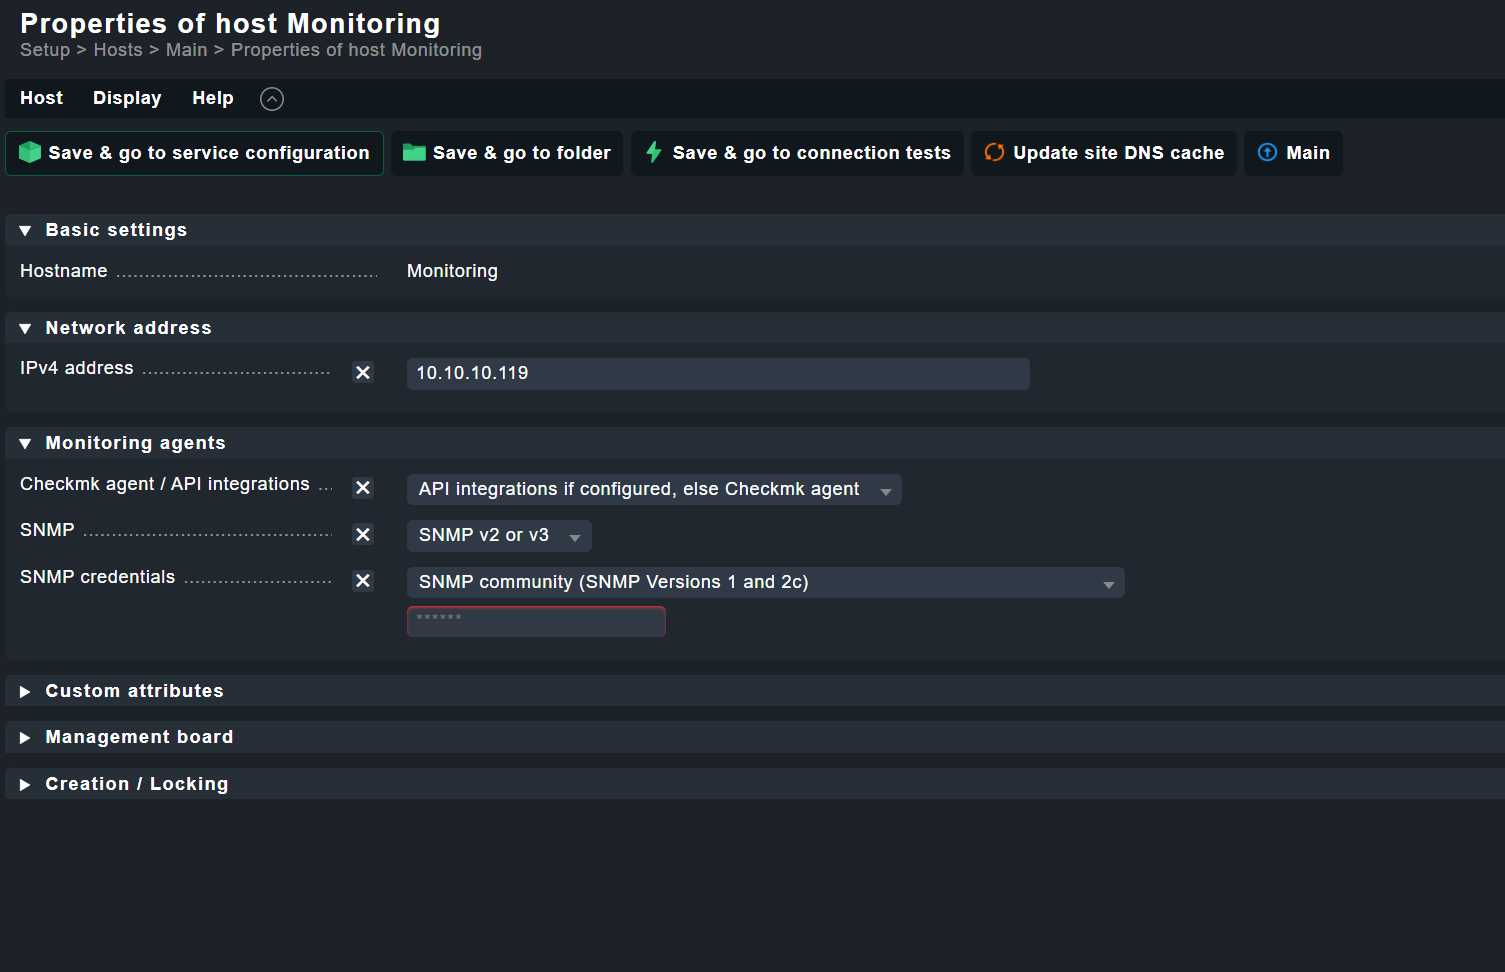
How am I monitoring “Itself” incorrectly?
I don’t see documentation for what steps are needed?
I added it self in the list of monitored devices, still no change. Can you point me to exactly what step is required ( documentation ) or screen captures?
This topic was automatically closed 365 days after the last reply. New replies are no longer allowed. Contact an admin if you think this should be re-opened.