Looking into this product it seems great. I’m evaluating the enterprise version for our monitoring solution at work. Currently we’re running the free PRTG but only as a stop gap because when I started they had zero monitoring, so I needed to get something in quickly just to get some insight into key interfaces and nodes. Deploying this the right way means well beyond the 100 free sensors from PRTG, so I’m looking at CheckMK to replace PRTG.
What I’ve gathered so far is that the raw edition is self hosted and free, but still uses the legacy Nagios methods while the enterprise edition is using a more modern check with sub-60 second visibility. I would install CheckMK agents on all of my linux and windows servers, and network equipment will use SNMP.
-
Even the enterprise version is self hosted correct?
-
Does CheckMK integrate with Aruba InstantOn devices? Check Plug-Ins Catalog the integration doesn’t mention anything about the cloud hosted wireless controllers that the InstantOn products use.
-
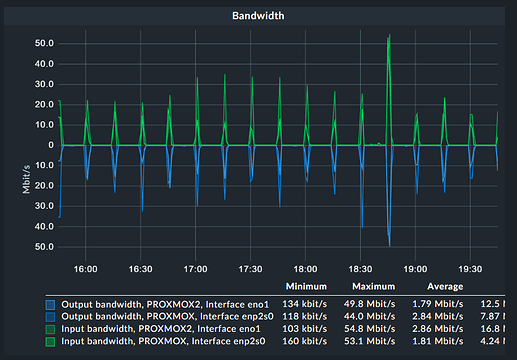
I’ve noticed that all of the bandwidth graphs report IN bandwidth as a positive number, and the OUT bandwidth as a negative number. Is there a way to stack both of these IN and OUT as positive numbers and lay them over each other? I don’t like having IN bandwidth above the 0 line, and OUT bandwidth below it.
-
Does CheckMK log windows eventlog data? Or other log data from devices? Like firewall logs, etc. Or are the events inside CheckMK just going to be alert events based on CPU, disk, network utilization, etc.?
-
Does CheckMK support native integration with SonicWall firewalls? I found this Checkmk Exchange but not sure if anyone is using it successfully.
-
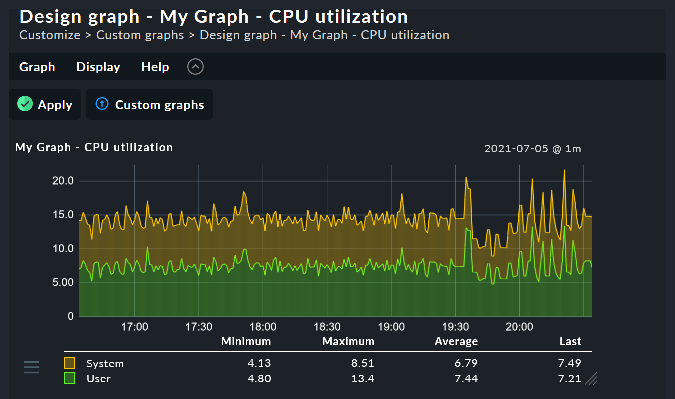
I’m a big dashboard person. I want each host to have an easy to navigate dashboard when you look at all the services for that host. When I’m looking at the CheckMK live demo : <cant include more than 2 links for some reason> I’m seeing some strange behavior on how you view hosts.
From the live demo, if I select a host by going to “Monitor → All Hosts → exchange-2” I am taken to a view.py link which displays all the monitored services in a table.
But if I go to “Monitor → Windows hosts → and select exhcnage-2 from the bottom” I am taken to a dashboard.py link which displays the exchange-2 server in a nice dashboard.
Other than accessing the host via the windows hosts page I am not clear how else to view this server as a dashboard. How do I make the dashboards the default when navigating to a host?