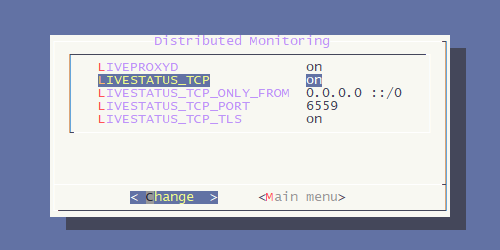
CMK version: 2.1.0p30.cee
OS version: Ubuntu 20.04 LTS
Error message: You called this page with an invalid host name.
Hi,
yesterday I updated my main site und distributed site to 2.1.0p30.cee.
In Wato I can see all my hosts and configure them. I can also scan services and can find the services. So everything seemed fine.
Today I noticed that in “All Hosts” view I see all the hosts from my main site but only 2 of my distributed site.
Distributed monitoring shows everything’s fine. I already did a new login to distributed site, which works fine.
When I login to the distributed site, I can see all the hosts and the services, but not on the master site.
I have a feeling, that it could have sth. to do with a host, which was monitored on the salve server, but is not there anymore. On my master server I see this old host in “All Hosts”. If I click “Edit Host” there I get the following error message:
You called this page with an invalid host name.
That is correct, because the host was deleted in WATO about 1.5 weeks before the upgrade.
But I can not get rid of this host on my master server.
Unfortunately because of that I think that the whole monitoring including notification for the hosts monitored by the slave site is not working correctly at the moment.
I already did following, but could not find any references:
grep -r HOSTNAME etc/*
Does anybody have an idea how I can fix it?
I’m not able to update to 2.2.x right now because we are using some WebApi integrations which are not yet migrated to RESTApi or LiveStatus.
Best regards
Roland
