Well, there is no perfdata.dump in the spool directory but 44000 perfdata.timestamp
OMD[office]:~$ cat /omd/sites/office/var/pnp4nagios/spool/perfdata.1588
Display all 44903 possibilities? (y or n)
They just have service entries from all monitoring:
DATATYPE::SERVICEPERFDATA TIMET::1588815465 HOSTNAME::localhost SERVICEDESC::Check_MK SERVICEPERFDATA::execution_time=0.122 user_time=0.020 system_time=0.000 children_user_time=0.000 children_system_time=0.000 cmk_time_agent=0.107 SERVICECHECKCOMMAND::check-mk SERVICESTATE::0 SERVICESTATETYPE::1
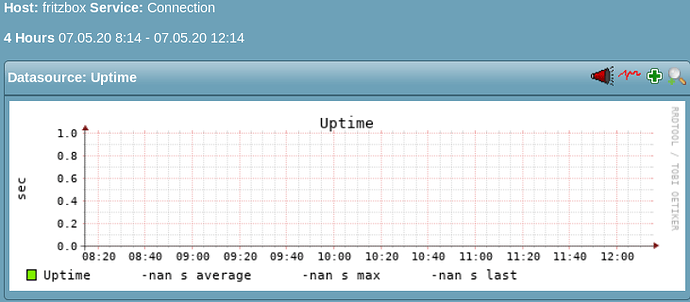
I am not sure, I rebooted it when I first noticed the high load then it ran over night and produced the high load warnings before I made this thread. There is no graph on any service since the update of check_mk raw not local not remote.
Just for example the local fritzbox:
