Npcd huge load after update

I just updated my monitor to version

OMD[office]:~/etc/nagios$ omd version
OMD - Open Monitoring Distribution Version 1.6.0p11.cre

And since then I get flooded with emails about high temperature.

Output:   CRIT - 83.0 °C (warn/crit at 70.0/80.0 °C)
Perfdata: temp=83;70;80;;

I checked the services and it shows, that there is a system load above 4 constantly. I stopped omd and the load went down below 1. Why is npcd causing so much load on the system and how can I stop it from frying my CPU (it goes over 80°C)?

top 5 minutes after restarting omd:

top - 18:11:18 up 4 days,  1:09,  1 user,  load average: 4.96, 4.45, 3.93
Tasks: 162 total,   6 running, 155 sleeping,   0 stopped,   1 zombie
%Cpu(s):  0.0 us,  6.5 sy, 45.9 ni, 47.6 id,  0.0 wa,  0.0 hi,  0.0 si,  0.0 st
MiB Mem :  15862.7 total,  13327.2 free,    697.1 used,   1838.4 buff/cache
MiB Swap:  16201.0 total,  16201.0 free,      0.0 used.  14667.7 avail Mem 

PID USER      PR  NI    VIRT    RES    SHR S  %CPU  %MEM     TIME+ COMMAND                                                                                                                  
25263 office    39  19  372864   3548   1804 S   5.0   0.0   0:43.03 npcd

My system is a Debian 10 with 8 cores:

OMD[office]:~/etc/nagios$ uname -a
Linux server 4.19.0-8-amd64 #1 SMP Debian 4.19.98-1+deb10u1 (2020-04-27) x86_64 GNU/Linux

The system ran for more than a year now and never experienced issues like this.

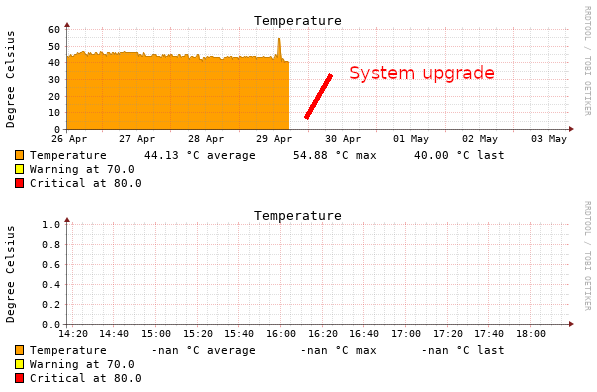
Additionally the temperature graph shows NaN since the latest update:

image2

It looks like a rrd problem. Is this temperature graph the only one with no data since the update?

You can have a look at your “~/var/rrdcached/” folder if there are more than usual journal files. In this Post i described a solution for a similar problem with rrd data processing.
The post is German but relevant part - how to solve the problem - is easy for Google translate :slight_smile:

I don’t know how many files there are usually but that’s how rrdcached looks like here:

OMD[office]:~$ ls -la var/rrdcached/
total 8
drwxr-xr-x  2 office office 4096 May  3 18:25 ./
drwxr-xr-x 14 office office 4096 Apr 23 15:03 ../
-rw-r--r--  1 office office    0 May  3 15:03 rrd.journal.1588511037.961790
-rw-r--r--  1 office office    0 May  3 17:03 rrd.journal.1588518237.961772
-rw-r-----  1 office office    0 May  3 17:55 rrd.journal.1588521351.653959
-rw-r--r--  1 office office    0 May  3 18:25 rrd.journal.1588523102.796071

They are all 0 bytes tho.

No biggie I am German myself :slight_smile: anyhow, if that’s the issue I could as a workaround put your solution in a cronjob. But I am unsure if that helps because the directory doesn’t look so dramatic.

For now I stopped npcd and scheduled the service. Since then the system load is at

load average: 0.09, 0.03, 0.02

Of course that’s certainly no solution but it shows that it has something to do with npcd.

You problem is something else. All journal files with 0 bytes is bad.
It looks like the npcd cannot write the performance data to the rrdcached daemon.
Please check the log files of your npcd / rrdcached.

The logfiles of rrdcached are empty and of npcd don’t exist. I don’t know where to investigate and what changed after the last update that caused this.

The log file of the core is the most important one i think.
Take a look at the entries with “npcdmod” inside. There you find also the spool directory of the performance data. Take a look at this directory.

I can not find anything in any logs. What exactly is the “log file of the core”?

Edit: btw I dont have any replication running. I am accessing a different site via VPN but that’s not a replication, I can not WATO to that site. That site has an own instance of Check_MK running and the local instance is just reading from there.

Edit 2: I have completely disabled npcd and set the service to downtime. I see no difference, the monitoring works as before, I get notifications when events happen on either site. Makes me wonder why I need npcd at all… I don’t understand, what npcd is doing there at all let alone why it causes such a high system load and why this happens just after I updated check_mk and never happened the years before.

Without npcd you get no performance data to the RRD files. High load on this process means you cannot write to the rrdcached.

Core log is inside ~/var/nagios

Unfortunately that log doesn’t give me anything I could work with. Just started the npcd again.

~/var/nagios/nagios.log

[1588842373] livestatus: Timeperiod cache not updated, there are no timeperiods (yet)
[1588842425] SERVICE ALERT: localhost;OMD office status;OK;HARD;1;OK - running
[1588842425] SERVICE NOTIFICATION: check-mk-notify;localhost;OMD office status;OK;check-mk-notify;OK - running
[1588842426] EXTERNAL COMMAND: _LOG;SERVICE NOTIFICATION: cmkadmin;localhost;OMD office status;OK;asciimail;OK - running
[1588842426] SERVICE NOTIFICATION: cmkadmin;localhost;OMD office status;OK;asciimail;OK - running
[1588842434] livestatus: Timeperiod cache not updated, there are no timeperiods (yet)
[1588842494] livestatus: Timeperiod cache not updated, there are no timeperiods (yet)

livestatus.log just is full of

2020-05-03 17:52:12 [main] socket thread has terminated

But that goes for a year already

OMD[office]:~$ zcat var/nagios/livestatus.log.7.gz 
2019-05-09 14:26:51 [main] socket thread has terminated
2019-06-03 22:31:05 [main] socket thread has terminated

Then there are these files

-rw-r--r--  1 office office 112800 May  3 18:34 objects.cache
-rw-r--r--  1 office office 112800 May  3 18:34 objects.precache
-rw-r--r--  1 office office 158683 May  7 10:34 retention.dat

That contain data about all services.

grepping for npcdmod repeats just the same log entries for years (the same exists from 2018 and 2019)

OMD[office]:~$ grep -r npcdmod var/nagios/*|grep 2020
...
var/nagios/archive/nagios-05-04-2020-00.log:[1588523669] Event broker module '/omd/sites/office/lib/npcdmod.o' deinitialized successfully.
var/nagios/archive/nagios-05-04-2020-00.log:[1588523671] npcdmod: Copyright (c) 2008-2009 Hendrik Baecker () - http://www.pnp4nagios.org
var/nagios/archive/nagios-05-04-2020-00.log:[1588523671] npcdmod: /omd/sites/office/etc/pnp4nagios/npcd.cfg initialized
var/nagios/archive/nagios-05-04-2020-00.log:[1588523671] npcdmod: spool_dir = '/omd/sites/office/var/pnp4nagios/spool/'.
var/nagios/archive/nagios-05-04-2020-00.log:[1588523671] npcdmod: perfdata file '/omd/sites/office/var/pnp4nagios/perfdata.dump'.
var/nagios/archive/nagios-05-04-2020-00.log:[1588523671] npcdmod: Ready to run to have some fun!
var/nagios/archive/nagios-05-04-2020-00.log:[1588523671] Event broker module '/omd/sites/office/lib/npcdmod.o' initialized successfully.
var/nagios/archive/nagios-04-30-2020-00.log:[1588162443] npcdmod: If you don't like me, I will go out! Bye.
var/nagios/archive/nagios-04-30-2020-00.log:[1588162443] Event broker module '/omd/sites/office/lib/npcdmod.o' deinitialized successfully.
var/nagios/archive/nagios-04-30-2020-00.log:[1588162576] npcdmod: Copyright (c) 2008-2009 Hendrik Baecker () - http://www.pnp4nagios.org
var/nagios/archive/nagios-04-30-2020-00.log:[1588162576] npcdmod: /omd/sites/office/etc/pnp4nagios/npcd.cfg initialized
var/nagios/archive/nagios-04-30-2020-00.log:[1588162576] npcdmod: spool_dir = '/omd/sites/office/var/pnp4nagios/spool/'.
var/nagios/archive/nagios-04-30-2020-00.log:[1588162576] npcdmod: perfdata file '/omd/sites/office/var/pnp4nagios/perfdata.dump'.
var/nagios/archive/nagios-04-30-2020-00.log:[1588162576] npcdmod: Ready to run to have some fun!
...

This looks ok.
If you look at the spool directory and the “perfdata.dump” file do you see anything there?

After a clean reboot of your monitoring machine is then the graphing working again?

Well, there is no perfdata.dump in the spool directory but 44000 perfdata.timestamp

OMD[office]:~$ cat /omd/sites/office/var/pnp4nagios/spool/perfdata.1588
Display all 44903 possibilities? (y or n)

They just have service entries from all monitoring:

DATATYPE::SERVICEPERFDATA TIMET::1588815465 HOSTNAME::localhost SERVICEDESC::Check_MK SERVICEPERFDATA::execution_time=0.122 user_time=0.020 system_time=0.000 children_user_time=0.000 children_system_time=0.000 cmk_time_agent=0.107 SERVICECHECKCOMMAND::check-mk SERVICESTATE::0 SERVICESTATETYPE::1

I am not sure, I rebooted it when I first noticed the high load then it ran over night and produced the high load warnings before I made this thread. There is no graph on any service since the update of check_mk raw not local not remote.

Just for example the local fritzbox:

Ok npcdmod inside your core is working he creates the files.
But then the npcd daemon must process he files and write the content to the RRD’s.
Inside the folder ~/var/pnp4nagios/log/ you find the npcd.log and perfdata.log.
There you should find many error messages :slight_smile:

Yep finally there’s something fishy. For some reasons it has problems with the timestamp.

OMD[office]:~/var/pnp4nagios$ ls -la log/
total 23372
drwxr-xr-x 2 office office     4096 May  3 18:30 ./
drwxr-xr-x 6 office office     4096 May  7 18:02 ../
-rw-r--r-- 1 office office  3273358 May  3 18:31 npcd.log
-rw-r--r-- 1 office office 10485960 May  3 18:30 npcd.log.old
-rw-rw-r-- 1 office office 10146847 Mar 25  2019 perfdata.log

OMD[office]:~/var/pnp4nagios$ tail log/npcd.log

[05-03-2020 18:31:40] NPCD: ERROR: Executed command exits with return code '1'
[05-03-2020 18:31:40] NPCD: ERROR: Command line was '/omd/sites/office/lib/pnp4nagios/process_perfdata.pl -n -c /omd/sites/office/etc/pnp4nagios/process_perfdata.cfg -b /omd/sites/office/var/pnp4nagios/spool//perfdata.1588209597'
[05-03-2020 18:31:40] NPCD: ERROR: Executed command exits with return code '1'
[05-03-2020 18:31:40] NPCD: ERROR: Command line was '/omd/sites/office/lib/pnp4nagios/process_perfdata.pl -n -c /omd/sites/office/etc/pnp4nagios/process_perfdata.cfg -b /omd/sites/office/var/pnp4nagios/spool//perfdata.1588209612'
[05-03-2020 18:31:40] NPCD: Caught Termination Signal - Astalavista... baby

perfdata.log last entry:

2019-03-25 20:48:16 [10686] [0] RRDs::update /omd/sites/office/var/pnp4nagios/perfdata/pfsense.backup/Check_MK_cmk_time_snmp.rrd 1553543282:0.130
2019-03-25 20:48:16 [10686] [0] RRDs::update ERROR rrdcached: illegal attempt to update using time 1553543282.000000 when last update time is 1553543282.000000 (minimum one second step

Although the log entries been quite old there was none from today when I let npcd run for a while.

I don’t know why this happened, because the system time is correct.

OMD[office]:~$ timedatectl 
           Local time: Thu 2020-05-07 17:51:37 CEST
       Universal time: Thu 2020-05-07 15:51:37 UTC
             RTC time: Thu 2020-05-07 15:51:37
            Time zone: Europe/Berlin (CEST, +0200)
System clock synchronized: yes
          NTP service: active
      RTC in local TZ: no

I deleted the rrd files from spool and now npcd runs without pushing systemload into orbit but the graphs still show nan

After letting it run for a day with a fresh spool directory, I still don’t see any perfdata in check_mk, the graphs still report nan.

Are all services running inside your site? The npcd service must run, if not then also no performance data.
If all services are running and you get no performance data, then take a look at your perfdata.log.

It is enough to have a one time false date value (1 year in the future or so :slight_smile: ) to destroy all rrd files. It is not possible to write to the rrd’s if you have already a value from the future inside there.

This topic was automatically closed 30 days after the last reply. New replies are no longer allowed.