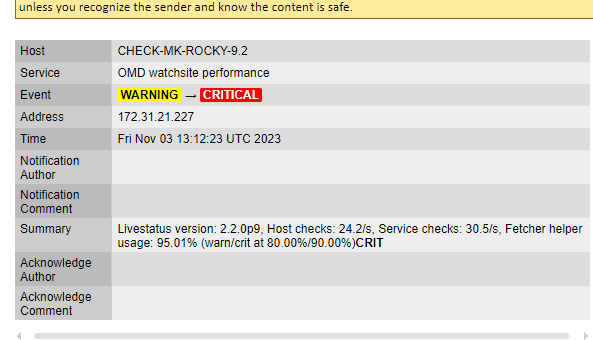
CMK version: 2.2.0
OS version: rockylinux9
Error message: i am getting this CRITICAL message on check-mk machine.
what needs to be done here?

CMK version: 2.2.0
OS version: rockylinux9
Error message: i am getting this CRITICAL message on check-mk machine.
what needs to be done here?

The message means that the Checkmk fetcher processes are occupied to 95%. Once the occupation reaches 100%, Checkmk agent checks will have to wait for a free fetcher process and your check latency increases.
You should consider increasing the number of fetcher processes. But be aware that fetcher processes consume memory, so keep an eye on the memory utilization. I typically run 50 fetcher processes on a Checkmk server VM with 16GB RAM.
hi Heavy
thanks for reply.
will monitor performance . can you please tell me where i can get the exact information for Core Monitoring settings? so that i can do the needful changes according to requirement?
The documentation on CMC fetchers and checkers should be a good starting point.
thanks Heavy .
can this information also be useful for identifying stale services issue which shows in dashboard ?
Stale services can have different reasons.
Among them is a (too) heavily loaded Checkmk server, so watch out for the metrics of the OMD performance check.
Other possible reasons include slow network connections and slow responses to Agent queries, maybe due to misbehaving 3rd party plugins or local checks.
for us , network connection can not be issue.
we are not using much of 3rd party plugins
we are using local check plugin , how i can verify/measure performance of our local check plugin (shell script )?
Maximum concurrent Checkmk fetchers current setting is 13 → changed to 30
Maximum concurrent active checks → from 5 changed to → 10
i have this stats at the moment.and i did the above changes from global settings.
i am not sure what needs to be done for apache WARN.
can you suggest anything ?
should i need to restart site ? so that performance count will change?
When you klick on the blue information sign at the left, a text appears that tells you what to do.
The Apache check typically warns you that the default number of processes might be too high.
hi Heavy
thanks for the reply
we are using local check plugin , how i can verify/measure performance of our local check plugin (shell script ) that is /usr/lib/check_mk_agent/local/localchq.sh.
i mean, how i can cross check that , if any plugin is not causing the stale service which comes in some interval ?
You can measure the execution time/load of a script with the time command, e.g.
# time /usr/lib/check_mk_agent/local/localchq.sh
[local check output]

real   0m0,014s
user   0m0,010s
sys    0m0,003s
If you suspect that the local check consumes to much time and is the source of stale services, consider putting it in a subdirectory so that it is executed cached. See
ok Thanks Heavy for the reply.
after some interval , i can see this messages in Monitor->History->Service check duration .
does it has any relation with stale service ?
HI Heavy , i was just checking the performance of local script .
time /usr/lib/check_mk_agent/local/localchq.sh
when i checked the time command to execute the script , its taking below time.
am i suppose to improve this ?
real 0m9.815s
user 0m1.946s
sys 0m5.231s
Either improve your scripts if possible or more fetchers.
Instead of 1s for each host, your fetchers are busy for up to 10-11s just with waiting. Thus, one fetcher can only do around 5 hosts instead of 30-40…
Hi Martin
Thanks for the reply.
also should i need to increase Maximum concurrent active checks ? currently i kept 20
is there any alternate to script ? because as per i know shell scripts are normally slow .
No - it depends on the programming of your scripts.
From some posts before - your agent execution time is very high for normal server systems. @martin.hirschvogel already gave the technical explanation and i would say a normal Linux / Windows server should not need more than 1 or 2 seconds for the agent query.
There are special cases where it could take longer but for the majority of systems a value between 0.5 and 2 seconds should be the target.
ok thanks Andreas for the reply.
This topic was automatically closed 365 days after the last reply. New replies are no longer allowed. Contact an admin if you think this should be re-opened.