My luck with 2.2 just hasn’t been great. Just installed this…everything is running, but states the instance is down when it isn’t. Did I miss something obvious in my checklist?
CMK version:
2.2.0p8
OS version:
Ubuntu 22.04.3
Error message:
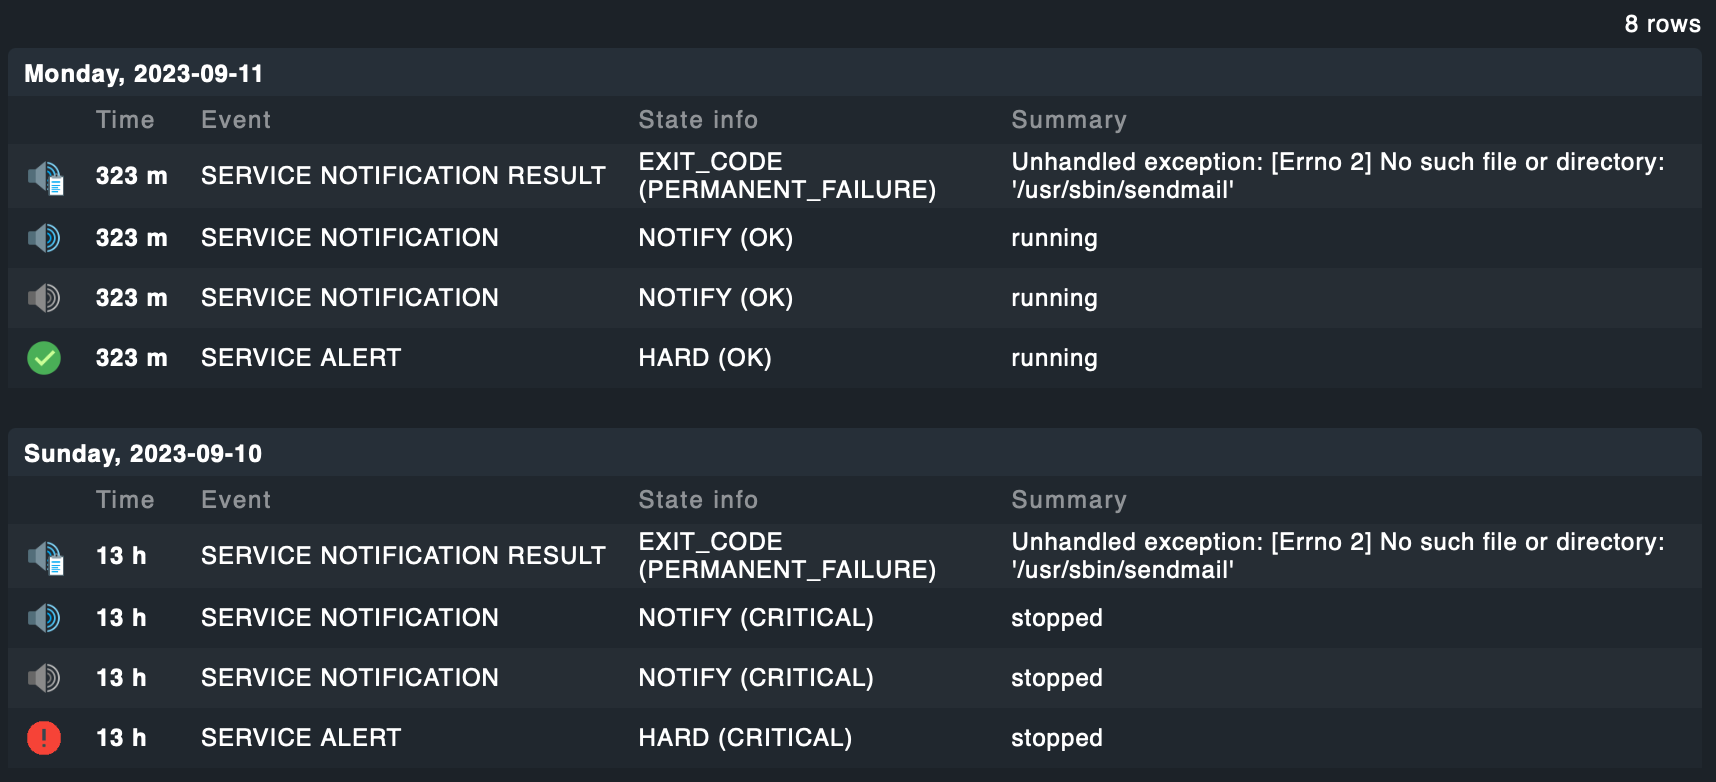
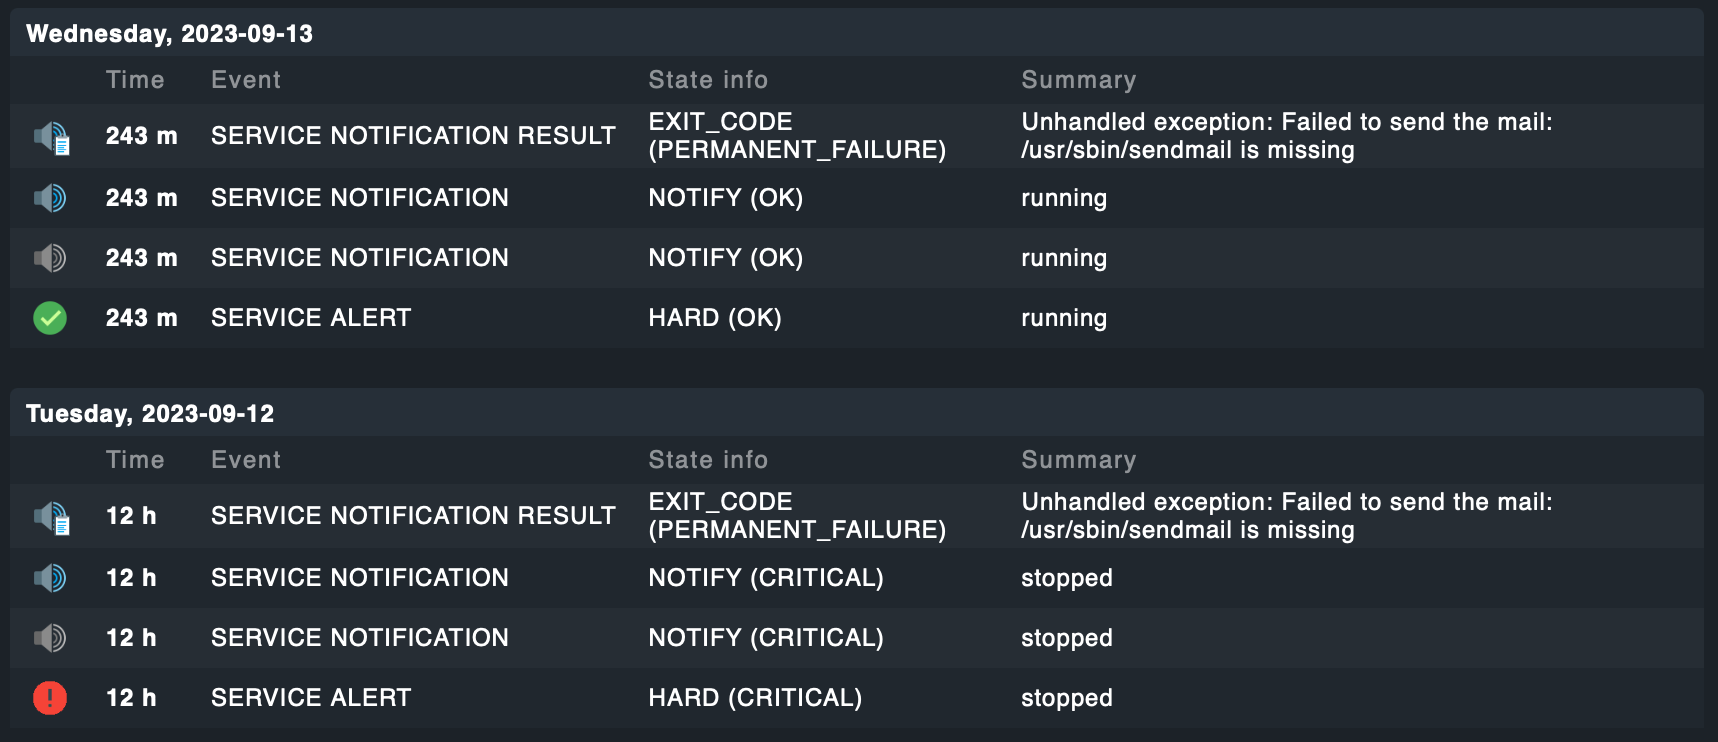
omd status stopped
Output of “cmk --debug -vvn hostname”: (If it is a problem with checks or plugins)
OMD[rsd]:~$ cmk --debug -vvn monitor
Checkmk version 2.2.0p8
+ FETCHING DATA
Source: SourceInfo(hostname='monitor', ipaddress='127.0.0.1', ident='agent', fetcher_type=<FetcherType.TCP: 8>, source_type=<SourceType.HOST: 1>)
[cpu_tracking] Start [7fc1ca2f6850]
Read from cache: AgentFileCache(monitor, path_template=/omd/sites/rsd/tmp/check_mk/cache/{hostname}, max_age=MaxAge(checking=0, discovery=120, inventory=120), simulation=False, use_only_cache=False, file_cache_mode=6)
Not using cache (Too old. Age is 0 sec, allowed is 0 sec)
[TCPFetcher] Execute data source
Connecting via TCP to 127.0.0.1:6556 (5.0s timeout)
Detected transport protocol: TransportProtocol.PLAIN (b'<<')
Reading data from agent
Closing TCP connection to 127.0.0.1:6556
Write data to cache file /omd/sites/rsd/tmp/check_mk/cache/monitor
Trying to acquire lock on /omd/sites/rsd/tmp/check_mk/cache/monitor
Got lock on /omd/sites/rsd/tmp/check_mk/cache/monitor
Releasing lock on /omd/sites/rsd/tmp/check_mk/cache/monitor
Released lock on /omd/sites/rsd/tmp/check_mk/cache/monitor
[cpu_tracking] Stop [7fc1ca2f6850 - Snapshot(process=posix.times_result(user=0.0, system=0.0, children_user=0.0, children_system=0.0, elapsed=0.6500000022351742))]
+ PARSE FETCHER RESULTS
<<<check_mk>>> / Transition NOOPParser -> HostSectionParser
<<<cmk_agent_ctl_status:sep(0)>>> / Transition HostSectionParser -> HostSectionParser
<<<checkmk_agent_plugins_lnx:sep(0)>>> / Transition HostSectionParser -> HostSectionParser
<<<labels:sep(0)>>> / Transition HostSectionParser -> HostSectionParser
<<<df_v2>>> / Transition HostSectionParser -> HostSectionParser
<<<df_v2>>> / Transition HostSectionParser -> HostSectionParser
<<<systemd_units>>> / Transition HostSectionParser -> HostSectionParser
<<<nfsmounts_v2:sep(0)>>> / Transition HostSectionParser -> HostSectionParser
<<<cifsmounts>>> / Transition HostSectionParser -> HostSectionParser
<<<mounts>>> / Transition HostSectionParser -> HostSectionParser
<<<ps_lnx>>> / Transition HostSectionParser -> HostSectionParser
<<<mem>>> / Transition HostSectionParser -> HostSectionParser
<<<cpu>>> / Transition HostSectionParser -> HostSectionParser
<<<uptime>>> / Transition HostSectionParser -> HostSectionParser
<<<lnx_if>>> / Transition HostSectionParser -> HostSectionParser
<<<lnx_if:sep(58)>>> / Transition HostSectionParser -> HostSectionParser
<<<tcp_conn_stats>>> / Transition HostSectionParser -> HostSectionParser
<<<multipath>>> / Transition HostSectionParser -> HostSectionParser
<<<diskstat>>> / Transition HostSectionParser -> HostSectionParser
<<<kernel>>> / Transition HostSectionParser -> HostSectionParser
<<<md>>> / Transition HostSectionParser -> HostSectionParser
<<<vbox_guest>>> / Transition HostSectionParser -> HostSectionParser
<<<livestatus_status:sep(59)>>> / Transition HostSectionParser -> HostSectionParser
<<<livestatus_ssl_certs:sep(124)>>> / Transition HostSectionParser -> HostSectionParser
<<<mkeventd_status:sep(0)>>> / Transition HostSectionParser -> HostSectionParser
<<<cmk_site_statistics:sep(59)>>> / Transition HostSectionParser -> HostSectionParser
<<<job>>> / Transition HostSectionParser -> HostSectionParser
<<<omd_status:cached(1694393258,60)>>> / Transition HostSectionParser -> HostSectionParser
<<<mknotifyd:sep(0)>>> / Transition HostSectionParser -> HostSectionParser
<<<omd_apache:sep(124)>>> / Transition HostSectionParser -> HostSectionParser
<<<omd_diskusage:sep(0)>>> / Transition HostSectionParser -> HostSectionParser
<<<omd_info:sep(59)>>> / Transition HostSectionParser -> HostSectionParser
<<<ntp:cached(1694393257,120)>>> / Transition HostSectionParser -> HostSectionParser
<<<local:sep(0)>>> / Transition HostSectionParser -> HostSectionParser
HostKey(hostname='monitor', source_type=<SourceType.HOST: 1>) -> Add sections: ['check_mk', 'checkmk_agent_plugins_lnx', 'cifsmounts', 'cmk_agent_ctl_status', 'cmk_site_statistics', 'cpu', 'df_v2', 'diskstat', 'job', 'kernel', 'labels', 'livestatus_ssl_certs', 'livestatus_status', 'lnx_if', 'local', 'md', 'mem', 'mkeventd_status', 'mknotifyd', 'mounts', 'multipath', 'nfsmounts_v2', 'ntp', 'omd_apache', 'omd_diskusage', 'omd_info', 'omd_status', 'ps_lnx', 'systemd_units', 'tcp_conn_stats', 'uptime', 'vbox_guest']
Received no piggyback data
[cpu_tracking] Start [7fc1c985a990]
value store: synchronizing
Trying to acquire lock on /omd/sites/rsd/tmp/check_mk/counters/monitor
Got lock on /omd/sites/rsd/tmp/check_mk/counters/monitor
value store: loading from disk
Releasing lock on /omd/sites/rsd/tmp/check_mk/counters/monitor
Released lock on /omd/sites/rsd/tmp/check_mk/counters/monitor
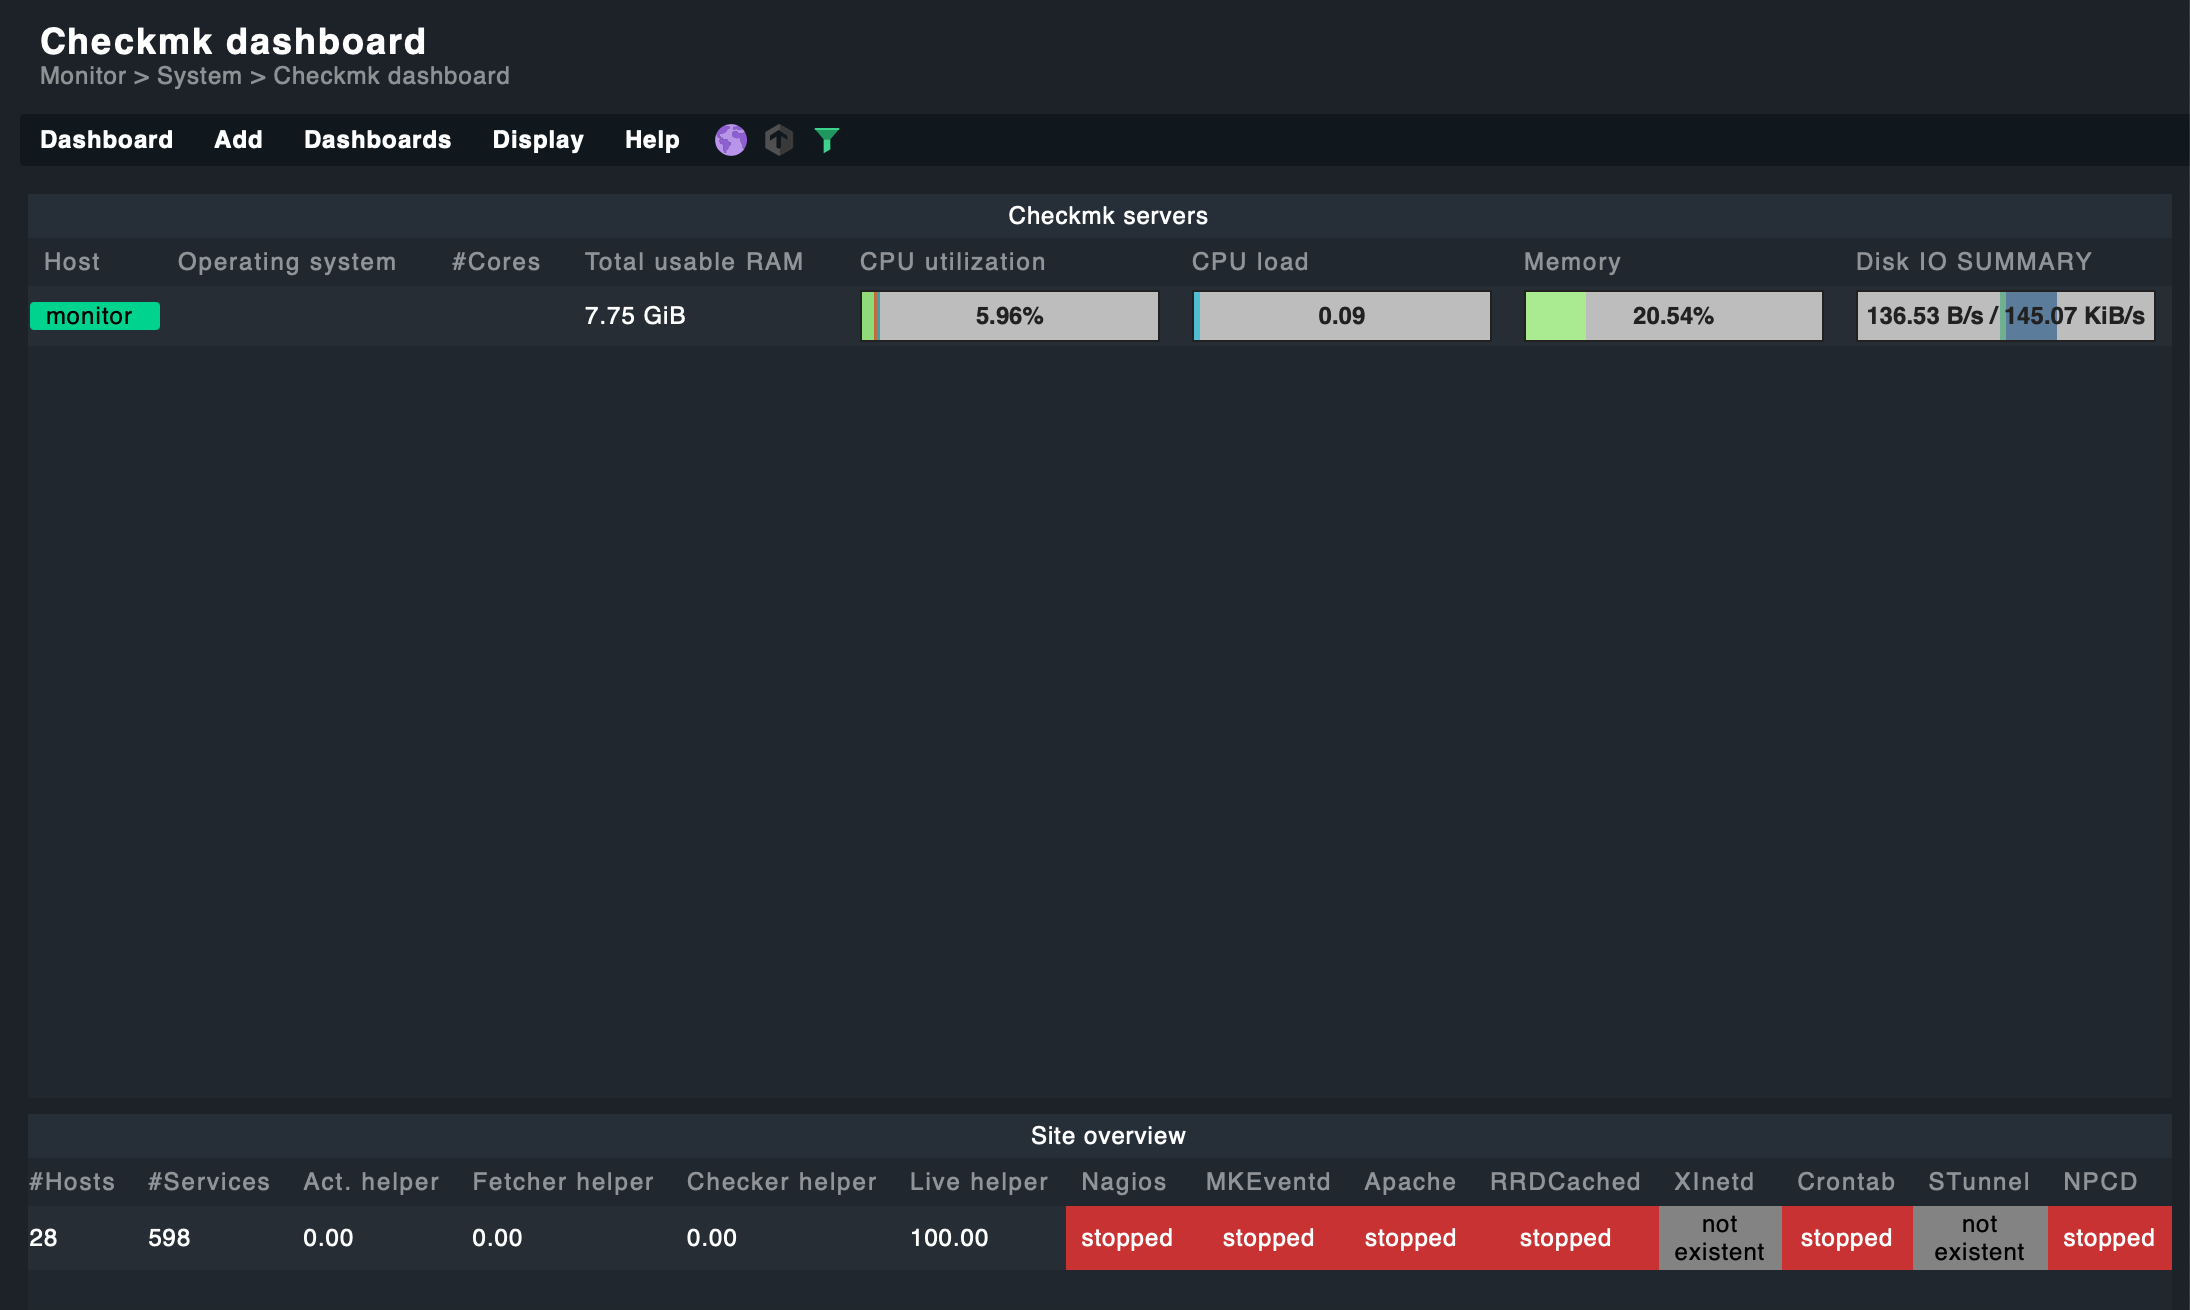
CPU load 15 min load: 0.21, 15 min load per core: 0.10 (2 cores)
CPU utilization Total CPU: 55.31%
Check_MK Agent Version: 2.2.0p8, OS: linux, TLS is not activated on monitored host (see details), Agent plugins: 0, Local checks: 0
Disk IO SUMMARY Read: 0.00 B/s, Write: 111 kB/s, Latency: 2 milliseconds
Filesystem / Used: 14.04% - 16.9 GiB of 121 GiB, trend per 1 day 0 hours: +739 MiB, trend per 1 day 0 hours: +0.60%, Time left until disk full: 143 days 12 hours
Filesystem /boot Used: 18.97% - 369 MiB of 1.90 GiB, trend per 1 day 0 hours: +0 B, trend per 1 day 0 hours: +0%
Filesystem /opt/omd/sites/rsd/tmp Used: 0.13% - 5.18 MiB of 3.88 GiB, trend per 1 day 0 hours: +693 MiB, trend per 1 day 0 hours: +17.47%, Time left until disk full: 5 days 17 hours
Interface 2 [ens192], (up), MAC: 00:0C:29:3C:E7:F5, Speed: 10 GBit/s, In: 1.51 kB/s (<0.01%), Out: 2.66 kB/s (<0.01%)
Interface 3 [tailscale0], (up), Speed: unknown, In: 318 B/s, Out: 1.34 kB/s
Kernel Performance Process Creations: 173.00/s, Context Switches: 3611.00/s, Major Page Faults: 0.00/s, Page Swap in: 0.00/s, Page Swap Out: 0.00/s
Memory Total virtual memory: 10.37% - 1.22 GiB of 11.8 GiB, 9 additional details available
Mount options of / Mount options exactly as expected
Mount options of /boot Mount options exactly as expected
NTP Time Found 5 peers, but none is suitable, Time since last sync: 20 minutes 33 seconds (warn/crit at 5 minutes 0 seconds/1 hour 0 minutes)(!)
Number of threads 371, Usage: 0.59%
OMD rsd Event Console Current events: 0, Virtual memory: 192 MiB, Overall event limit inactive, No hosts event limit active, No rules event limit active, Received messages: 0.00/s, Rule hits: 0.00/s, Rule tries: 0.00/s, Message drops: 0.00/s, Created events: 0.00/s, Client connects: 0.76/s, Rule hit ratio: -, Processing time per message: -, Time per client request: 0.15 ms
OMD rsd apache No activity since last check
OMD rsd disk usage Total: 242 MiB, Agents: 0 B, Core: 210 KiB, History: 0 B, Inventory: 10.5 KiB, Local: 296 KiB, Logs: 731 KiB, PNP4Nagios: 230 MiB, RRDs: 0 B, Tmp: 670 KiB
OMD rsd performance Livestatus version: 2.2.0p8, Host checks: 0.1/s, Service checks: 2.2/s
OMD rsd status stopped
Site rsd statistics Total hosts: 7, Problem hosts: 0, Total services: 180, Problem services: 7
Systemd Service Summary Total: 156, Disabled: 2, Failed: 0
Systemd Socket Summary Total: 23, Disabled: 0, Failed: 0
TCP Connections Established: 6
Uptime Up since Sep 10 2023 11:46:25, Uptime: 22 minutes 7 seconds
+ EXECUTING INVENTORY PLUGINS
allnet_ip_sensoric: skipped (no data)
allnet_ip_sensoric: skipped (no data)
aruba_wlc_aps: skipped (no data)
aruba_wlc_aps: skipped (no data)
check_mk: ok
check_mk: skipped (no data)
checkmk_agent_plugins: ok
checkmk_agent_plugins: skipped (no data)
cisco_meraki_org_device_info: skipped (no data)
cisco_meraki_org_device_info: skipped (no data)
dell_hw_info: skipped (no data)
dell_hw_info: skipped (no data)
docker_node_info: skipped (no data)
docker_node_info: skipped (no data)
esx_systeminfo: skipped (no data)
esx_systeminfo: skipped (no data)
fireeye_sys_status: skipped (no data)
fireeye_sys_status: skipped (no data)
fritz: skipped (no data)
fritz: skipped (no data)
hp_proliant_da_phydrv: skipped (no data)
hp_proliant_da_phydrv: skipped (no data)
hp_proliant_mem: skipped (no data)
hp_proliant_mem: skipped (no data)
hp_proliant_systeminfo: skipped (no data)
hp_proliant_systeminfo: skipped (no data)
ibm_mq_channels: skipped (no data)
ibm_mq_channels: skipped (no data)
ibm_mq_managers: skipped (no data)
ibm_mq_managers: skipped (no data)
ibm_mq_queues: skipped (no data)
ibm_mq_queues: skipped (no data)
infoblox_osinfo: skipped (no data)
infoblox_osinfo: skipped (no data)
infoblox_systeminfo: skipped (no data)
infoblox_systeminfo: skipped (no data)
inv_cisco_vlans: skipped (no data)
inv_cisco_vlans: skipped (no data)
inv_esx_vsphere_hostsystem: skipped (no data)
inv_esx_vsphere_hostsystem: skipped (no data)
inv_if: ok
inv_if: skipped (no data)
aix_baselevel: skipped (no data)
aix_baselevel: skipped (no data)
aix_lparstat_inventory: skipped (no data)
aix_lparstat_inventory: skipped (no data)
aix_packages: skipped (no data)
aix_packages: skipped (no data)
aix_service_packs: skipped (no data)
aix_service_packs: skipped (no data)
azure_load_balancer: skipped (no data)
azure_load_balancer: skipped (no data)
inventory_checkmk: ok
inventory_checkmk: skipped (no data)
checkpoint_vpn_tunnels: skipped (no data)
checkpoint_vpn_tunnels: skipped (no data)
citrix_controller: skipped (no data)
citrix_controller: skipped (no data)
citrix_state: skipped (no data)
citrix_state: skipped (no data)
couchbase_nodes_ports: skipped (no data)
couchbase_nodes_ports: skipped (no data)
dmidecode: skipped (no data)
dmidecode: skipped (no data)
docker_container_labels: skipped (no data)
docker_container_labels: skipped (no data)
docker_container_network: skipped (no data)
docker_container_network: skipped (no data)
inventory_docker_container_node_name: skipped (no data)
inventory_docker_container_node_name: skipped (no data)
docker_node_images: skipped (no data)
docker_node_images: skipped (no data)
docker_node_network: skipped (no data)
docker_node_network: skipped (no data)
enviromux_micro_information: skipped (no data)
enviromux_micro_information: skipped (no data)
inventory_esx_vsphere_clusters: skipped (no data)
inventory_esx_vsphere_clusters: skipped (no data)
inventory_esx_vsphere_virtual_machines: skipped (no data)
inventory_esx_vsphere_virtual_machines: skipped (no data)
fortiauthenticator_system: skipped (no data)
fortiauthenticator_system: skipped (no data)
fortigate_ha: skipped (no data)
fortigate_ha: skipped (no data)
fortimail_system: skipped (no data)
fortimail_system: skipped (no data)
fortinet_firewall_network_interfaces: skipped (no data)
fortinet_firewall_network_interfaces: skipped (no data)
fortisandbox_software: skipped (no data)
fortisandbox_software: skipped (no data)
fortisandbox_system: skipped (no data)
fortisandbox_system: skipped (no data)
ipmi_firmware: skipped (no data)
ipmi_firmware: skipped (no data)
k8s_service_info: skipped (no data)
k8s_service_info: skipped (no data)
kube_cluster: skipped (no data)
kube_cluster: skipped (no data)
kube_cronjob: skipped (no data)
kube_cronjob: skipped (no data)
kube_daemonset: skipped (no data)
kube_daemonset: skipped (no data)
kube_deployment: skipped (no data)
kube_deployment: skipped (no data)
kube_namespace: skipped (no data)
kube_namespace: skipped (no data)
kube_node: skipped (no data)
kube_node: skipped (no data)
kube_pod: skipped (no data)
kube_pod: skipped (no data)
kube_statefulset: skipped (no data)
kube_statefulset: skipped (no data)
lnx_block_devices: skipped (no data)
lnx_block_devices: skipped (no data)
lnx_ip_r: skipped (no data)
lnx_ip_r: skipped (no data)
lnx_packages: skipped (no data)
lnx_packages: skipped (no data)
lnx_sysctl: skipped (no data)
lnx_sysctl: skipped (no data)
lnx_video: skipped (no data)
lnx_video: skipped (no data)
mobileiron_inventory: skipped (no data)
mobileiron_inventory: skipped (no data)
mssql_clusters: skipped (no data)
mssql_clusters: skipped (no data)
oracle_systemparameter: skipped (no data)
oracle_systemparameter: skipped (no data)
primekey: skipped (no data)
primekey: skipped (no data)
snmp_extended_info: skipped (no data)
snmp_extended_info: skipped (no data)
solaris_addresses: skipped (no data)
solaris_addresses: skipped (no data)
solaris_pkginfo: skipped (no data)
solaris_pkginfo: skipped (no data)
solaris_cpus: skipped (no data)
solaris_cpus: skipped (no data)
solaris_routes: skipped (no data)
solaris_routes: skipped (no data)
statgrab_net: skipped (no data)
statgrab_net: skipped (no data)
win_bios: skipped (no data)
win_bios: skipped (no data)
win_disks: skipped (no data)
win_disks: skipped (no data)
win_exefiles: skipped (no data)
win_exefiles: skipped (no data)
win_ip_r: skipped (no data)
win_ip_r: skipped (no data)
win_networkadapter: skipped (no data)
win_networkadapter: skipped (no data)
win_reg_uninstall: skipped (no data)
win_reg_uninstall: skipped (no data)
win_video: skipped (no data)
win_video: skipped (no data)
win_wmi_software: skipped (no data)
win_wmi_software: skipped (no data)
win_wmi_updates: skipped (no data)
win_wmi_updates: skipped (no data)
juniper_info: skipped (no data)
juniper_info: skipped (no data)
k8s_pod_container: skipped (no data)
k8s_pod_container: skipped (no data)
lnx_cpuinfo: skipped (no data)
lnx_cpuinfo: skipped (no data)
lnx_distro: skipped (no data)
lnx_distro: skipped (no data)
lnx_if: ok
lnx_if: skipped (no data)
lnx_uname: skipped (no data)
lnx_uname: skipped (no data)
lparstat_aix: skipped (no data)
lparstat_aix: skipped (no data)
mem: ok
mem: skipped (no data)
mem_used: skipped (no data)
mem_used: skipped (no data)
mssql_instance: skipped (no data)
mssql_instance: skipped (no data)
netapp_api_disk: skipped (no data)
netapp_api_disk: skipped (no data)
netapp_api_info: skipped (no data)
netapp_api_info: skipped (no data)
oracle_dataguard_stats: skipped (no data)
oracle_dataguard_stats: skipped (no data)
oracle_instance: skipped (no data)
oracle_instance: skipped (no data)
oracle_performance: skipped (no data)
oracle_performance: skipped (no data)
oracle_recovery_area: skipped (no data)
oracle_recovery_area: skipped (no data)
oracle_tablespaces: skipped (no data)
oracle_tablespaces: skipped (no data)
perle_chassis: skipped (no data)
perle_chassis: skipped (no data)
perle_chassis_slots: skipped (no data)
perle_chassis_slots: skipped (no data)
perle_psmu: skipped (no data)
perle_psmu: skipped (no data)
prtconf: skipped (no data)
prtconf: skipped (no data)
snmp_quantum_storage_info: skipped (no data)
snmp_quantum_storage_info: skipped (no data)
snmp_info: skipped (no data)
snmp_info: skipped (no data)
solaris_prtdiag: skipped (no data)
solaris_prtdiag: skipped (no data)
solaris_uname: skipped (no data)
solaris_uname: skipped (no data)
suseconnect: skipped (no data)
suseconnect: skipped (no data)
win_computersystem: skipped (no data)
win_computersystem: skipped (no data)
win_cpuinfo: skipped (no data)
win_cpuinfo: skipped (no data)
win_os: skipped (no data)
win_os: skipped (no data)
win_system: skipped (no data)
win_system: skipped (no data)
winperf_if: skipped (no data)
winperf_if: skipped (no data)
Trying to acquire lock on /omd/sites/rsd/tmp/check_mk/status_data/monitor
Got lock on /omd/sites/rsd/tmp/check_mk/status_data/monitor
Releasing lock on /omd/sites/rsd/tmp/check_mk/status_data/monitor
Released lock on /omd/sites/rsd/tmp/check_mk/status_data/monitor
Trying to acquire lock on /omd/sites/rsd/tmp/check_mk/status_data/monitor.gz
Got lock on /omd/sites/rsd/tmp/check_mk/status_data/monitor.gz
Releasing lock on /omd/sites/rsd/tmp/check_mk/status_data/monitor.gz
Released lock on /omd/sites/rsd/tmp/check_mk/status_data/monitor.gz
[cpu_tracking] Stop [7fc1c985a990 - Snapshot(process=posix.times_result(user=0.009999999999999898, system=0.0, children_user=0.0, children_system=0.0, elapsed=0.019999999552965164))]
[agent] Success, execution time 0.7 sec | execution_time=0.670 user_time=0.010 system_time=0.000 children_user_time=0.000 children_system_time=0.000 cmk_time_agent=0.650