Output of “cmk --debug -vvn hostname”: (If it is a problem with checks or plugins)
n/a
**We are aware of RAW edition, we are on, is meant to use more CPU. **
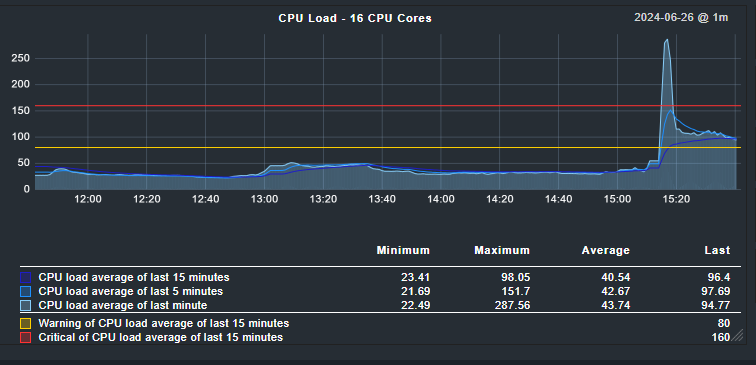
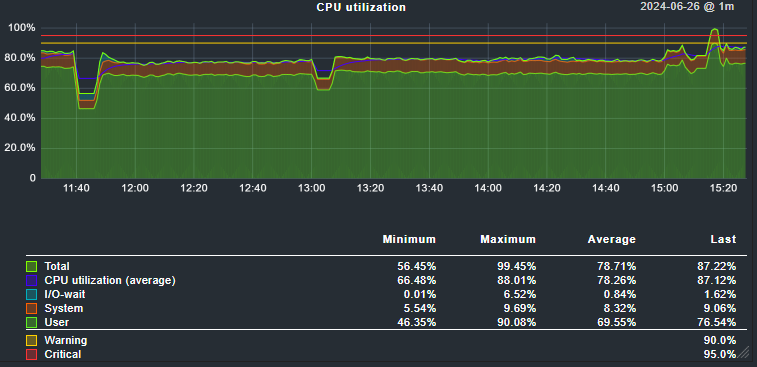
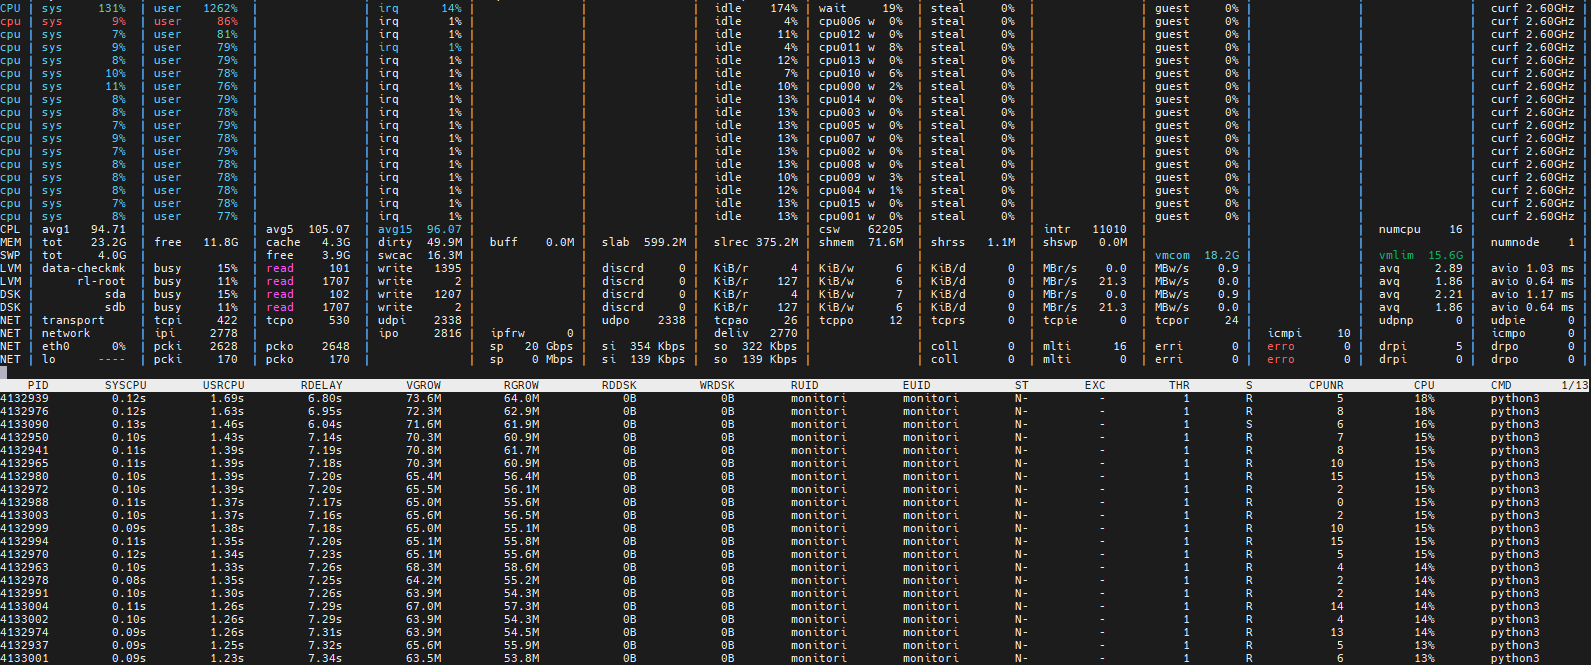
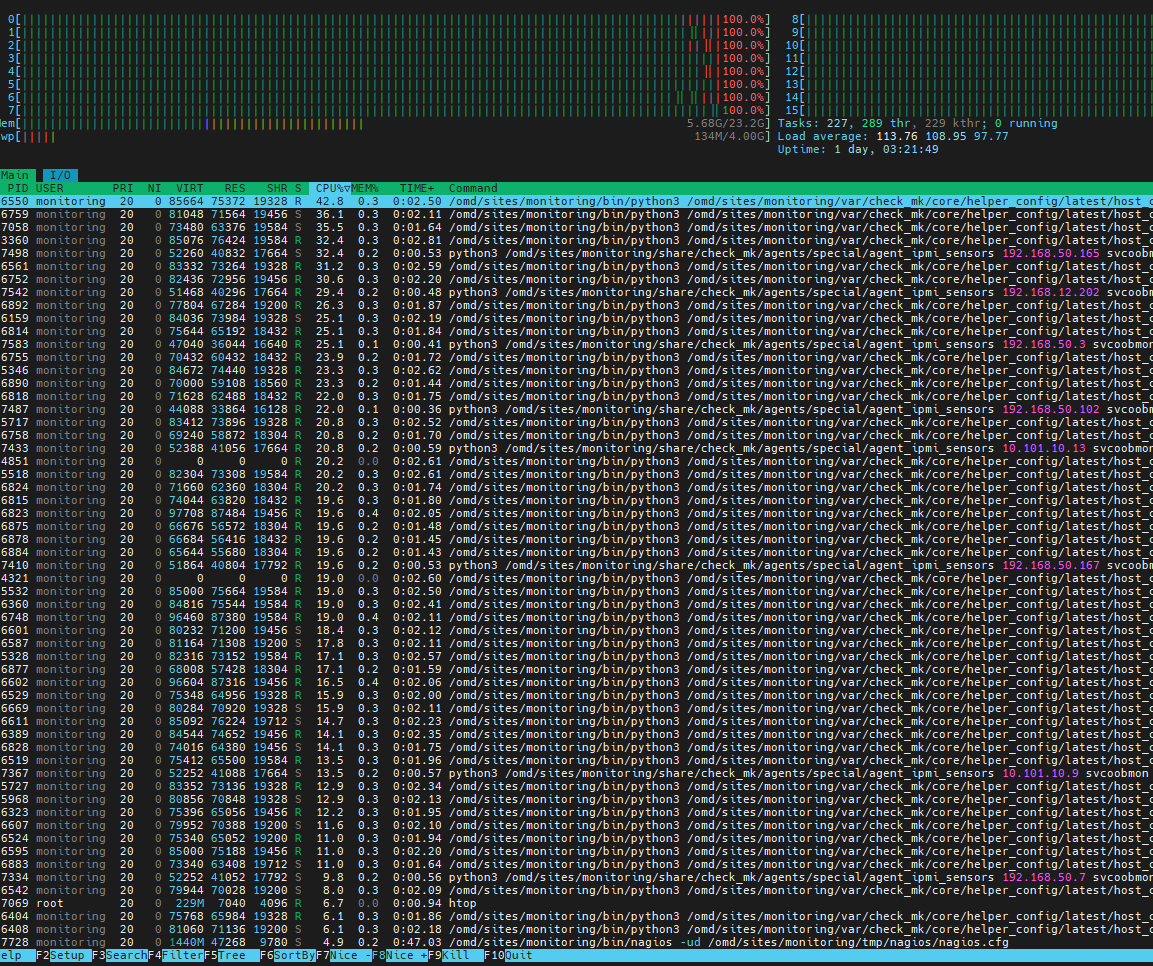
Regardless of version 2.2 or 2.3 now, usually the load is at 20-30, sometimes, at random times, CPU load spikes over 100, then after few hours drops. Also restarting checkmk server via “omd restart” helps for few hours then abnormal load is back. Aside from OS tools like top/htop/atop, are there any other internal metrics or logs that checkmk server offers?
any way to identify / show what checkmk server is doing at any given time (what is it running or executing, what checks?) ? any omd tools?
can I identify or break it down by Folders or Host tags? or types of checks?
In my example it is around 1 seconds.
Now you take your value and multiply it with your number of hosts (297) to get the needed CPU time for one check cycle.
If i take 5 seconds for your devices (that is already a high value) then i will need around 2500 CPU seconds for one cycle.
This value divided with your available number of cores and i get around 156 seconds per core and check cycle.
If i take the values from your screenshot (around 2 seconds) - then i need 62-63 seconds per core and check cycle. You with the default check interval of 1 minute you will not be happy on your system.
I’m currently working for a customer who has recently switched over from CRE to CCE and I have observed this behaviour to appear “randomly” as well when still running on CRE with the nagios core.
What makes it worse and should be reproducible everytime is when you set a lot of downtimes but still let these hosts do their active checks.
Are you using the “password store” feature? I read in another thread that even if you had a password in it, or still have one in it, even if you don’t use it (anymore), CRE will still do some expensive/intensive decryption.
@andreas-doehler I think you were involved in this thread and might recall the details.
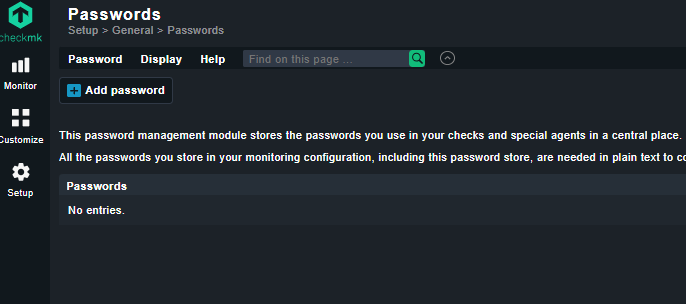
I do not use password store feature if I understand it correctly:
Also taking into account Andreas’s response about check_mk response values, I was able to narrow down extremely high times to the “Networking Gear” folder where most devices were using snmpv1 and all devices (switches, routers, vpn, voip) under HW/SW Discovery rule.
After peeling off/disabling HW/SW Discovery and switching from snmpv1 to snmpv2 CPU load averages around 9-14 at this moment.
Will keep an eye for next few days, I think I can get away without HW/SW Discovery turned on and use it on the need basis.
This topic was automatically closed 365 days after the last reply. New replies are no longer allowed. Contact an admin if you think this should be re-opened.