Hello guys,
i created a view, where the “Hosts/Service: Graphs” of some Routers are shown.
But i dont need the “Packets”, “Error” and “Lenght of output queue” graphs, I only need the Bandwidth graph.
Is there a way to only show the “Bandwidth”- graph ?
Hi,
there are different way to solve this
my favorite is to build a dashboard with the needed informations
or
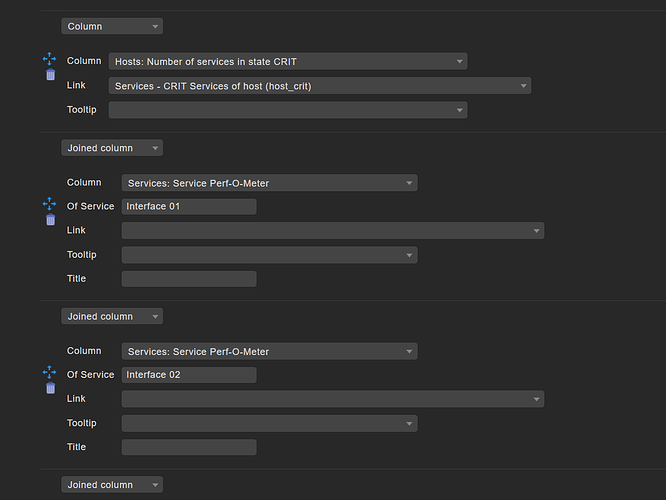
create a new view with joinend columms
point 3.7
or made an Dashboard for this in Grafana
Thank you for your fast answer 
I tried now using joined columns, but i have no clue what to write into the field “Of Service” to only show the Bandwidth.
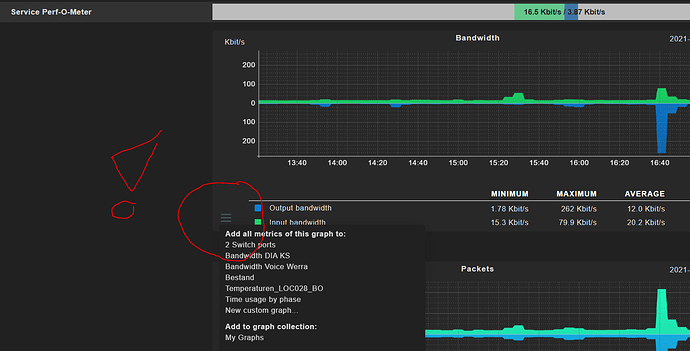
This looks good at first, but it would be better if it were a Graph.
Is it possible to show the Perf-O-Meter as an Graph or do I need to use Graphana ?
This topic was automatically closed 365 days after the last reply. New replies are no longer allowed. Contact @fayepal if you think this should be re-opened.


