We are monitoring our Palo Alto VM-200 node with SNMP v3 in Check MK 2.0.0p17. There’s only one CPU utilization check visible in Check MK, while there are actually two OID’s in the snmpwalk which indicates CPU utilization:
OID 1.3.6.1.2.1.25.3.3.1.2.1 returns an integer of the Management CPU only
OID 1.3.6.1.2.1.25.3.3.1.2.2 returns an integer of the Data Plane CPU only
There’s no OID which averages both values
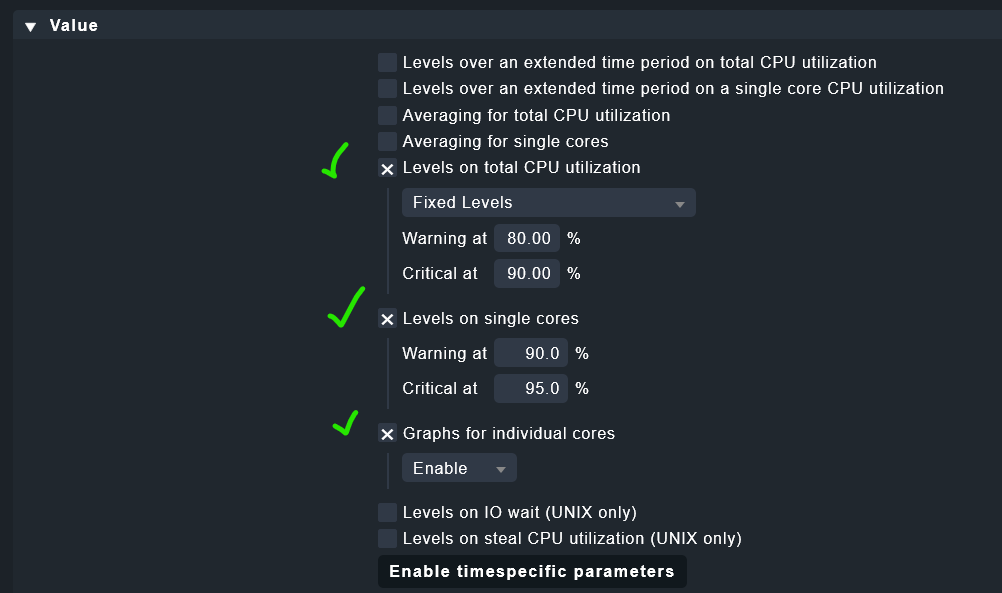
We are very interested in monitoring only the Data Plane CPU utilization, or at least separate both, but looking at the live values in Check MK, the check seems to somehow average both values. How can we have the CPU check look at a specific OID instead of averaging multiple values? I tried editing some CPU parameters, but that didn’t seem to make a difference:
The check the system uses is the normal “hr_cpu” check. That means that the outside world don’t know what OID is witch CPU. For CMK it looks like a two core CPU.
Inside the rule “CPU utilization for simple devices” there is an option “Levels on single cores”. I think this is the only option you can use for alarms on one of the two cores.
It would be nice to know if the Palo Alto provides better or more data over it’s REST API.
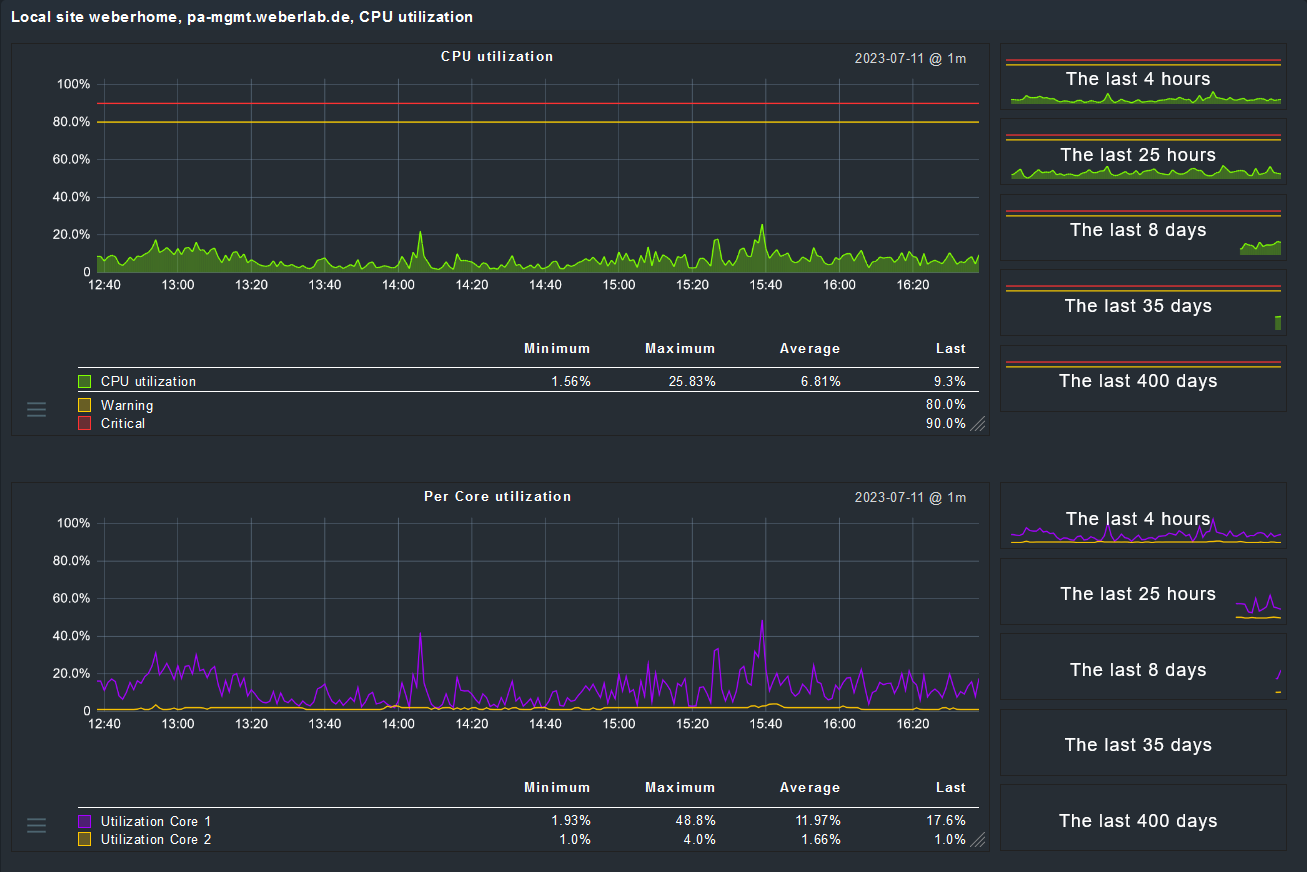
You will get a second graph with a line for each core.
Core 1 is the Management Plane
Core 2 is the Data Plane.
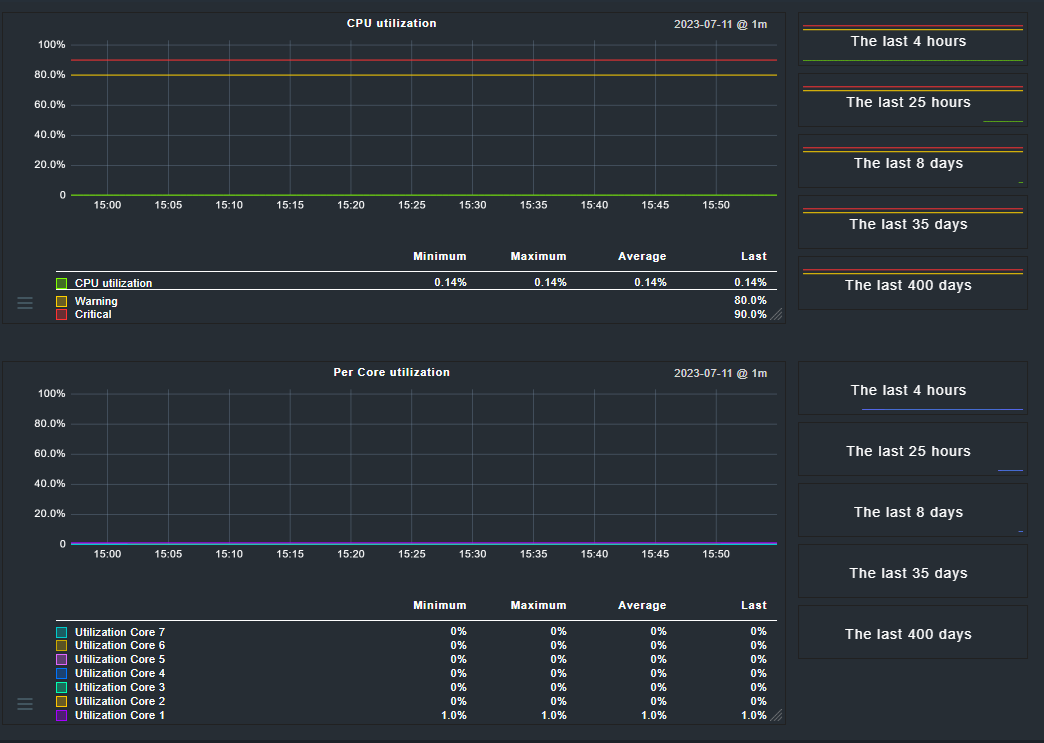
A multi-core Data Plane is still reported as 1 Core. There is no SNMP counter for each single DP core as far as I know. However a Palo Alto does a pretty good job in levelling the load over its available DP cores.
This topic was automatically closed 365 days after the last reply. New replies are no longer allowed. Contact an admin if you think this should be re-opened.